ClimateForecastAprilMay >>

Average monthly rainy days in Marsh Harbour

The number of days each month with rain, snow and hail in Marsh Harbour (Abaco Islands), the Bahamas.

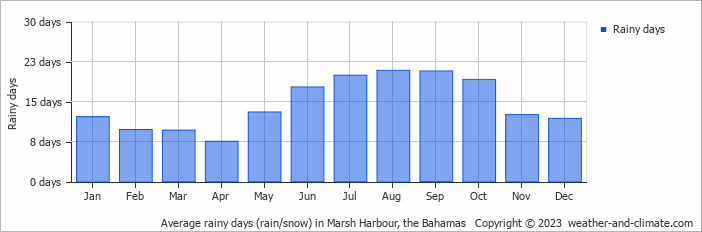
  • Most rainy days are in June, July, August, September and October.
  • On average, August is the most rainy with 20 days of rain/snow.
  • On average, April is the driest month with 7 rainy days.
  • The average annual number of rainy days is 174.

Weather Forecasts for Marsh Harbour

Thu   Apr 25
24°C | 20°C
E 14 km/h
almost clear and no rain

almost clear and no rain

Fri   Apr 26
27°C | 18°C
NE 25 km/h
partly cloudy and no rain

partly cloudy and no rain

Sat   Apr 27
27°C | 19°C
E 36 km/h
0.7 mm
partly cloudy and small chance of slight rain

partly cloudy and small chance of slight rain

Interested in more climate information?

Weather and Climate provides you with all the information you need about the climate in Marsh Harbour.

Our site offers climate and forecast data for every country in the world. Are you going to the Bahamas? On this website you can find historical weather averages for many cities in the Bahamas. Not sure yet where to go? We now have a tool which recommends destinations that suit your ideal climate conditions. Find out where to go with our weather planner.