Average Rainy - Precipitation days in Marlengo
Over the course of the year, Marlengo experiences 1357 mm of rain/snow across 176 days. On this page you will discover more about the number of precipitation days.
Monthly Distribution of Rainy Days
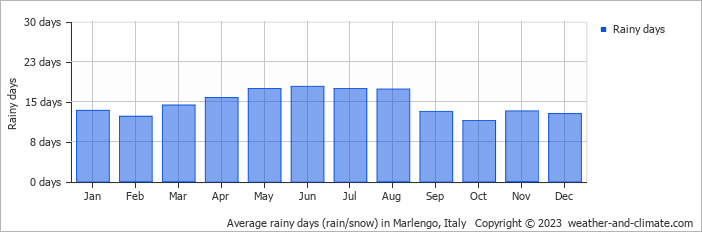
Precipitation peaks in July with 164 mm falling over 17 rainy days. The driest period is January, receiving 58 mm across 13 snowy days.
Amsterdam Precipitation Days Compared World Wide
Marlengo's average annual precipitation falls over 176 days. Let's compare this to some popular worldwide tourist destinations:
In Riyadh, Saudi Arabia, there are about 29 precipitation days annually, reflecting its dry desert environment.
In Kuala Lumpur, Malaysia, the city experiences around 212 precipitation days annually, consistent with its tropical rainforest climate.
The city of Rome, Italy, averages 131 precipitation days annually, spread fairly evenly throughout the year.
Every year, the city of New York, USA, records about 130 precipitation days, with rainfall evenly distributed throughout the year.
In Shanghai, China, there are approximately 147 precipitation days per year, with a humid subtropical climate.
Perth, Australia, sees approximately 103 precipitation days annually, mostly during the winter months.
Rain Facts From Around the Globe
Let’s explore more fascinating precipitation records:
- Tutunendo, Colombia, gets about 340 days of rain every year, which arguably makes it the wettest place in the world.
- On Réunion Island, a tropical cyclone generated 1825 mm in just 24 hours.
- Singapore receives thunder on 167 days in the year and is considered one of the most thunderous cities in the world.
- The smallest drops that fall are called drizzle drops, and they have a diameter of 0.5 mm.
- Some heavy storms generate "diamond dust," which consists of very small ice crystals that float in the air.
For more detailed information about rainfall patterns in Marlengo, visit our Rainfall & Precipitation page.
Current rainfall in Marlengo


