Monthly Average Rainy days in Manhattan Beach (CA)
The number of days each month with rain, snow and hail in Manhattan Beach (California), the United States of America.
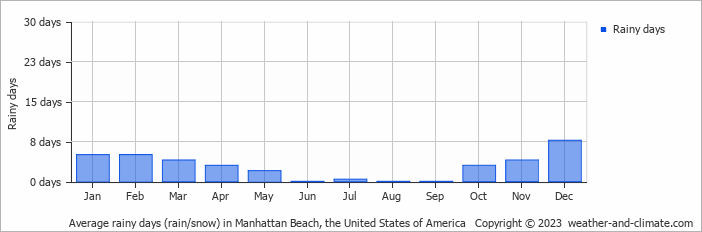
- Manhattan Beach has dry periods in May, June, July, August and September.
- On average, December is the most rainy with 7 days of rain/snow.
- On average, September is the driest month with 0 rainy days.
- The average annual number of rainy days is 34.
Current rainfall in Manhattan Beach (CA)
Tue Nov 26
18°C | 13°C
W  14 km/h
14 km/hbroken clouds and no rain
Wed Nov 27
19°C | 12°C
W 7 km/h
7 km/hovercast and no rain
Thu Nov 28
20°C | 11°C
W 7 km/h
7 km/halmost clear and no rain


