Average monthly rainy days in Le Robert
The number of days each month with rain, snow and hail in Le Robert (), Martinique.
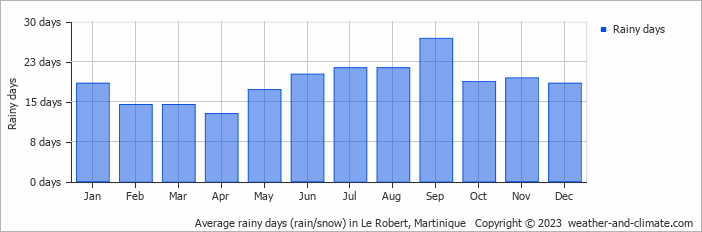
- Most rainy days are in January, May, June, July, August, September, October, November and December.
- On average, September is the most rainy with 26 days of rain/snow.
- On average, April is the driest month with 12 rainy days.
- The average annual number of rainy days is 222.
Weather Forecasts for Le Robert
Sat Apr 27
32°C | 24°C
NE  36 km/h
36 km/hpartly cloudy and no rain
Sun Apr 28
32°C | 23°C
E 36 km/h
36 km/h0.5 mm
partly cloudy and small chance of slight rain
Mon Apr 29
31°C | 24°C
E 32 km/h
32 km/h5.9 mm
partly cloudy and rain


