Monthly Average Rainy days in La Martre
The number of days each month with rain, snow and hail in La Martre (Quebec), Canada.
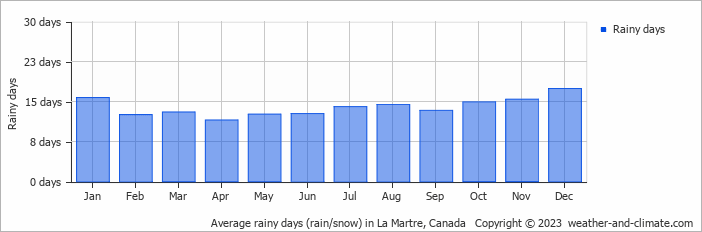
- Most rainy days are in January, November and December.
- On average, December is the most rainy with 17 days of rain/snow.
- On average, April is the driest month with 11 rainy days.
- The average annual number of rainy days is 167.
Current rainfall in La Martre
Sun Jan 05
-4°C | -12°C
W  11 m/s
11 m/s4 mm
broken clouds and snow
Mon Jan 06
-4°C | -6°C
W 3 m/s
3 m/s45 mm
overcast and heavy snow
Tue Jan 07
-2°C | -6°C
W 4 m/s
4 m/s44 mm
overcast and heavy snow