Monthly Average Rainy days in Ko Si Chang
The number of days each month with rain, snow and hail in Ko Si Chang (Chon Buri Province), Thailand.
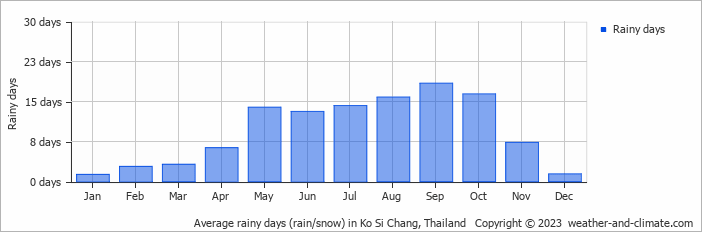
- Most rainy days are in August, September and October.
- Ko Si Chang has dry periods in January and December.
- On average, September is the most rainy with 18 days of rain/snow.
- On average, January is the driest month with 1 rainy day.
- The average annual number of rainy days is 114.
Current rainfall in Ko Si Chang
Mon Jan 06
30°C | 23°C
NE  2 m/s
2 m/s
2 m/spartly cloudy and no rain
Tue Jan 07
30°C | 24°C
NE 2 m/s
2 m/sclear and no rain
Wed Jan 08
31°C | 24°C
NE 2 m/s
2 m/sclear and no rain


