ClimateForecastAprilMay >>

Average monthly rainy days in Kirmenjak

The number of days each month with rain, snow and hail in Kirmenjak (), Croatia.

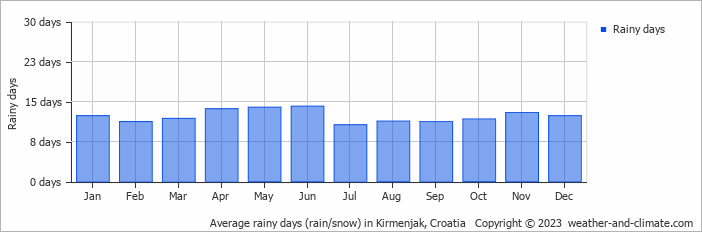
  • On average, June is the most rainy with 14 days of rain/snow.
  • On average, July is the driest month with 10 rainy days.
  • The average annual number of rainy days is 146.

Weather Forecasts for Kirmenjak

Mon   Apr 29
23°C | 9°C
NE 7 km/h
clear and no rain

clear and no rain

Tue   Apr 30
24°C | 9°C
E 7 km/h
clear and no rain

clear and no rain

Wed   May 01
23°C | 12°C
SE 18 km/h
8.4 mm
broken clouds and  chance of rain

broken clouds and chance of rain

Interested in more climate information?

Weather and Climate provides you with all the information you need about the climate in Kirmenjak.

Our site offers climate and forecast data for every country in the world. Are you going to Croatia? On this website you can find historical weather averages for many cities in Croatia. Not sure yet where to go? We now have a tool which recommends destinations that suit your ideal climate conditions. Find out where to go with our weather planner.