Average Rainy - Precipitation days in Kinmun
With 149 days and 3234 mm of annual rain, Kinmun has a moderate precipitation pattern. On this page, you can learn everything about the number of precipitation days.
Monthly Distribution of Rainy Days
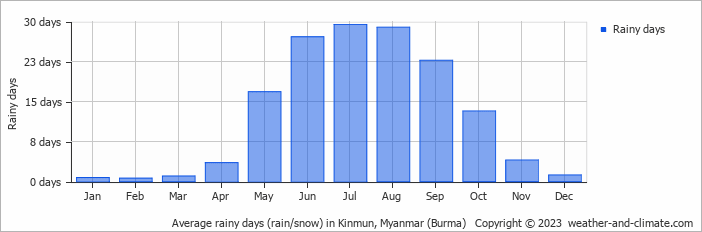
July is usually the wettest with 706 mm of rain over 29 rainy days, whereas February averages 3.7 mm during its a single rainy day.
Amsterdam Precipitation Days Compared World Wide
On average, Kinmun receives over 149 days of precipitation annually. For comparison, here is some data from popular tourist destinations around the world:Las Vegas, USA, gets about 26 precipitation days annually, which is typical for its arid desert climate.
In Bogotá, Colombia, there are around 188 precipitation days annually, typical for its high-altitude tropical climate.
The city of Rome, Italy, averages 131 precipitation days annually, spread fairly evenly throughout the year.
Chicago, USA, has 133 precipitation days annually, with a mix of rain and snow.
In Shanghai, China, there are approximately 147 precipitation days per year, with a humid subtropical climate.
In Brisbane, Australia, the city averages 123 precipitation days per year, making it wetter than Sydney.
Rain Facts From Around the Globe
Let’s explore more fascinating precipitation records:
- Tutunendo, Colombia, gets about 340 days of rain every year, which arguably makes it the wettest place in the world.
- On Réunion Island, a tropical cyclone generated 1825 mm in just 24 hours.
- Singapore receives thunder on 167 days in the year and is considered one of the most thunderous cities in the world.
- The smallest drops that fall are called drizzle drops, and they have a diameter of 0.5 mm.
- Some heavy storms generate "diamond dust," which consists of very small ice crystals that float in the air.
For more detailed information about rainfall patterns in Kinmun, visit our Rainfall & Precipitation page.
Current rainfall in Kinmun


