ClimateForecastMayJune >>

Average monthly rainy days in Kings Beach (CA)

The number of days each month with rain, snow and hail in Kings Beach (California), the United States of America.

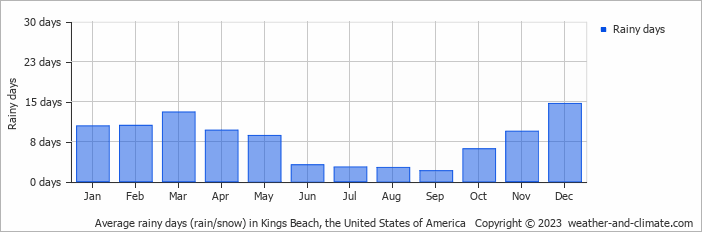
  • On average, December is the most rainy with 14 days of rain/snow.
  • On average, September is the driest month with 2 rainy days.
  • The average annual number of rainy days is 92.

Forecast for Kings Beach (CA)

Sat   May 04
8°C | -3°C
SW 32 km/h
24 mm
broken clouds and sleet

broken clouds and sleet

Sun   May 05
4°C | -3°C
W 22 km/h
1.6 mm
partly cloudy and  chance of slight snow

partly cloudy and chance of slight snow

Mon   May 06
10°C | -2°C
W 18 km/h
almost clear and no rain

almost clear and no rain

Interested in more climate information?

This site provides you with all the information you need about the climate in Kings Beach.

Our site offers climate and forecast data for every country in the world. Are you going to the United States of America? On this website you can find historical weather averages for many cities in the United States of America. Not sure yet where to go? We now have a tool which recommends destinations that suit your ideal climate conditions. Find out where to go with our weather planner.