Monthly Average Rainy days in Indore
The number of days each month with rain, snow and hail in Indore (Madhya Pradesh), India.
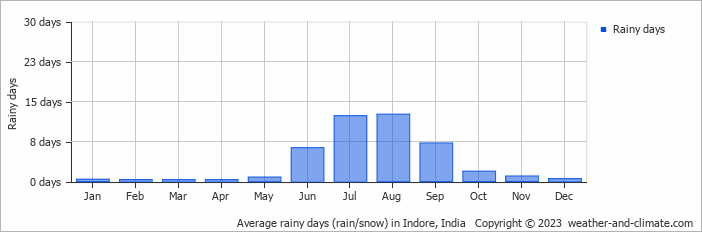
- Indore has dry periods in January, February, March, April, May, October, November and December.
- On average, August is the most rainy with 12 days of rain/snow.
- On average, March is the driest month with 0 rainy days.
- The average annual number of rainy days is 43.
Current rainfall in Indore
Sat Dec 21
27°C | 13°C
E  4 m/s
4 m/s
4 m/sclear and no rain
Sun Dec 22
27°C | 13°C
E 4 m/s
4 m/sclear and no rain
Mon Dec 23
26°C | 15°C
S 4 m/s
4 m/salmost clear and no rain


