Monthly Average Rainy days in Herradura
The number of days each month with rain, snow and hail in Herradura (Puntarenas), Costa Rica.
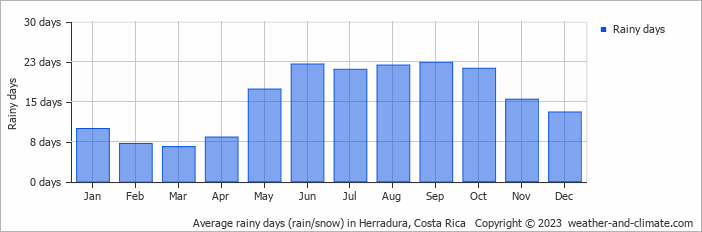
- Most rainy days are in May, June, July, August, September, October and November.
- On average, September is the most rainy with 22 days of rain/snow.
- On average, March is the driest month with 6 rainy days.
- The average annual number of rainy days is 185.
Current rainfall in Herradura
Sat Jan 11
29°C | 24°C
S  4 m/s
4 m/s
4 m/s0.4 mm
broken clouds and small chance of slight rain
Sun Jan 12
28°C | 25°C
S 3 m/s
3 m/s0.5 mm
partly cloudy and small chance of slight rain
Mon Jan 13
28°C | 24°C
S 4 m/s
4 m/sbroken clouds and no rain