Monthly Average Rainy days in Havelock Island
The number of days each month with rain, snow and hail in Havelock Island (Andaman Islands), India.
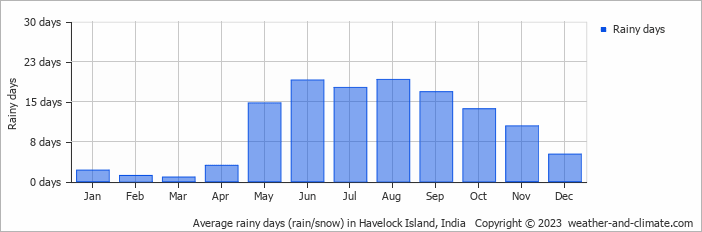
- Most rainy days are in June, July, August and September.
- Havelock Island has dry periods in February and March.
- On average, August is the most rainy with 19 days of rain/snow.
- On average, March is the driest month with 0 rainy days.
- The average annual number of rainy days is 123.
Current rainfall in Havelock Island
Sun Dec 22
30°C | 27°C
E  6 m/s
6 m/s
6 m/s3.6 mm
broken clouds and rain
Mon Dec 23
31°C | 27°C
E 6 m/s
6 m/spartly cloudy and no rain
Tue Dec 24
30°C | 26°C
E 5 m/s
5 m/salmost clear and no rain


