Average Rainy - Precipitation days in Harboør
Harboør sees 185 days of precipitation annually, totaling to 976 mm of rain/snow. Learn more about it on this page.
Monthly Distribution of Rainy Days
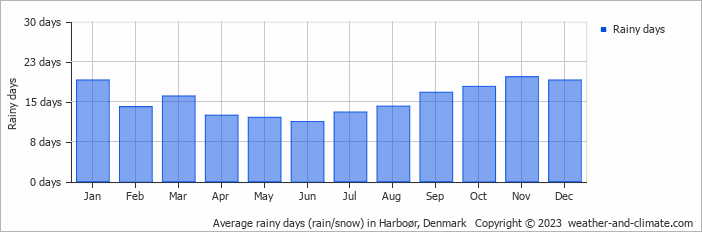
The wettest month is October, with 18 rainy days bringing 114 mm of rain. In contrast, April sees 12 rainy days with 52 mm of rain.
Amsterdam Precipitation Days Compared World Wide
Harboør's average annual precipitation falls over 185 days. Let's compare this to some popular worldwide tourist destinations:
Las Vegas, USA, gets about 26 precipitation days annually, which is typical for its arid desert climate.
In Kuala Lumpur, Malaysia, the city experiences around 212 precipitation days annually, consistent with its tropical rainforest climate.
In Athens, Greece, it rains around 70 days in the year; therefore, it is one of the driest Mediterranean cities, mainly dominated by winter rainfall.
The climate in San Francisco, USA, sees around 70 precipitation days annually, mostly during the winter months.
In Seoul, South Korea, the city experiences 106 precipitation days annually, with most rain falling during the summer monsoon season.
In Brisbane, Australia, the city averages 123 precipitation days per year, making it wetter than Sydney.
Fun facts about Rain from Around the World
Let’s explore more fascinating precipitation records:
- Tutunendo, Colombia, gets about 340 days of rain every year, which arguably makes it the wettest place in the world.
- On Réunion Island, a tropical cyclone generated 1825 mm in just 24 hours.
- Singapore receives thunder on 167 days in the year and is considered one of the most thunderous cities in the world.
- The smallest drops that fall are called drizzle drops, and they have a diameter of 0.5 mm.
- Some heavy storms generate "diamond dust," which consists of very small ice crystals that float in the air.
For more detailed information about rainfall patterns in Harboør, visit our Rainfall & Precipitation page.
Current rainfall in Harboør


