Average monthly rainy days in Gravina di Catania
The number of days each month with rain, snow and hail in Gravina di Catania (), Italy.
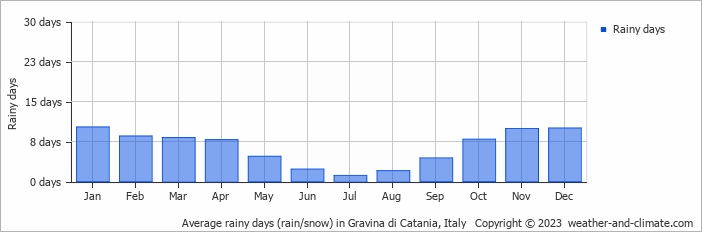
- Gravina di Catania has dry periods in July and August.
- On average, January is the most rainy with 10 days of rain/snow.
- On average, July is the driest month with 1 rainy day.
- The average annual number of rainy days is 76.
Weather Forecasts for Gravina di Catania
Fri May 03
23°C | 10°C
NW  7 km/h
7 km/halmost clear and no rain
Sat May 04
20°C | 10°C
S 4 km/h
4 km/halmost clear and no rain
Sun May 05
20°C | 11°C
E 11 km/h
11 km/hclear and no rain


