Monthly Average Rainy days in Governorʼs Harbour
The number of days each month with rain, snow and hail in Governorʼs Harbour (Harbour Island), the Bahamas.
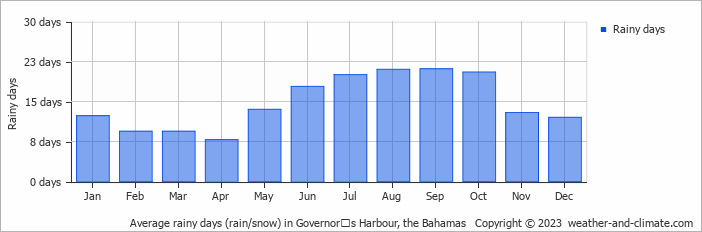
- Most rainy days are in June, July, August, September and October.
- On average, September is the most rainy with 21 days of rain/snow.
- On average, April is the driest month with 7 rainy days.
- The average annual number of rainy days is 177.
Current rainfall in Governorʼs Harbour
Sat Jan 11
26°C | 19°C
W  8 m/s
8 m/s
8 m/salmost clear and no rain
Sun Jan 12
24°C | 19°C
N 5 m/s
5 m/salmost clear and no rain
Mon Jan 13
23°C | 18°C
NE 3 m/s
3 m/salmost clear and no rain


