ClimateForecastMayJune >>

Average monthly rainy days in Gornja Brela

The number of days each month with rain, snow and hail in Gornja Brela (), Croatia.

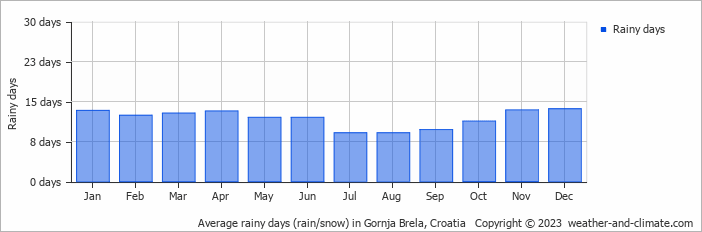
  • On average, December is the most rainy with 13 days of rain/snow.
  • On average, August is the driest month with 9 rainy days.
  • The average annual number of rainy days is 141.

Forecast for Gornja Brela

Sun   May 05
22°C | 10°C
SW 7 km/h
almost clear and no rain

almost clear and no rain

Mon   May 06
22°C | 10°C
S 11 km/h
partly cloudy and no rain

partly cloudy and no rain

Tue   May 07
21°C | 12°C
SE 18 km/h
2.1 mm
broken clouds and  chance of rain

broken clouds and chance of rain

Interested in more climate information?

This site provides you with all the information you need about the climate in Gornja Brela.

Our site offers climate and forecast data for every country in the world. Are you going to Croatia? On this website you can find historical weather averages for many cities in Croatia. Not sure yet where to go? We now have a tool which recommends destinations that suit your ideal climate conditions. Find out where to go with our weather planner.