Monthly Average Rainy days in Gig Harbor (WA)
The number of days each month with rain, snow and hail in Gig Harbor (Washington State), the United States of America.
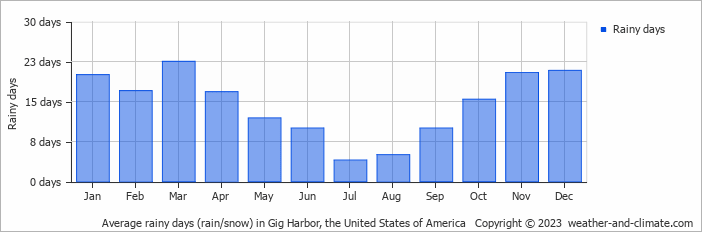
- Most rainy days are in January, February, March, April, October, November and December.
- On average, March is the most rainy with 22 days of rain/snow.
- On average, July is the driest month with 4 rainy days.
- The average annual number of rainy days is 173.
Current rainfall in Gig Harbor (WA)
Tue Dec 24
11°C | 7°C
SW  5 m/s
5 m/s
5 m/s2.3 mm
almost clear and chance of slight rain
Wed Dec 25
9°C | 7°C
S 5 m/s
5 m/s24 mm
overcast and heavy rain
Thu Dec 26
11°C | 8°C
SW 6 m/s
6 m/s16 mm
broken clouds and rain


