ClimateForecastMayJune >>

Average monthly rainy days in Dolní Chabry

The number of days each month with rain, snow and hail in Dolní Chabry (), Czech Republic.

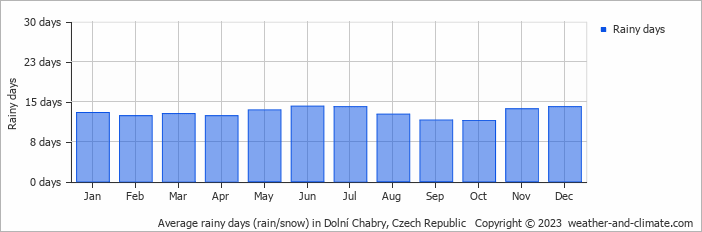
  • On average, June is the most rainy with 14 days of rain/snow.
  • On average, October is the driest month with 11 rainy days.
  • The average annual number of rainy days is 154.

Weather Forecasts for Dolní Chabry

Thu   May 02
23°C | 13°C
SE 32 km/h
0.5 mm
partly cloudy and small chance of slight rain

partly cloudy and small chance of slight rain

Fri   May 03
18°C | 9°C
W 14 km/h
3.9 mm
broken clouds and rain

broken clouds and rain

Sat   May 04
21°C | 8°C
N 14 km/h
broken clouds and no rain

broken clouds and no rain

Interested in more climate information?

Weather and Climate provides you with all the information you need about the climate in Dolní Chabry.

Our site offers climate and forecast data for every country in the world. Are you going to Czech Republic? On this website you can find historical weather averages for many cities in Czech Republic. Not sure yet where to go? We now have a tool which recommends destinations that suit your ideal climate conditions. Find out where to go with our weather planner.