Average Rainy - Precipitation days in Cranfield
Over the course of the year, Cranfield experiences 722 mm of rain/snow across 172 days. On this page you will discover more about the number of precipitation days.
Monthly Distribution of Rainy Days
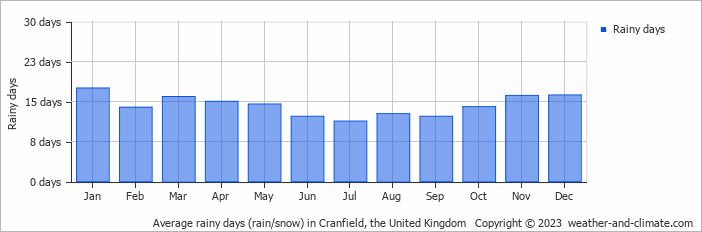
Precipitation peaks in August with 67 mm falling over 13 rainy days. The driest period is March, receiving 49 mm across 16 rainy days.
Amsterdam Precipitation Days Compared World Wide
Cranfield's average annual precipitation falls over 172 days. Let's compare this to some popular worldwide tourist destinations:
In Cairo, Egypt, there are only about 16 precipitation days annually, making it one of the driest capitals in the world.
Singapore, Singapore, records about 175 precipitation days per year, with rain spread fairly evenly throughout the year.
The city of Rome, Italy, averages 131 precipitation days annually, spread fairly evenly throughout the year.
Chicago, USA, has 133 precipitation days annually, with a mix of rain and snow.
Buenos AiresBuenos Aires, Argentina, has around 92 precipitation days annually, mostly during the summer months.
In Tokyo, Japan, the city sees around 181 precipitation days annually, with significant summer rains due to typhoon season.
Fun facts about Rain from Around the World
Let’s explore more fascinating precipitation records:
- Tutunendo, Colombia, gets about 340 days of rain every year, which arguably makes it the wettest place in the world.
- On Réunion Island, a tropical cyclone generated 1825 mm in just 24 hours.
- Singapore receives thunder on 167 days in the year and is considered one of the most thunderous cities in the world.
- The smallest drops that fall are called drizzle drops, and they have a diameter of 0.5 mm.
- Some heavy storms generate "diamond dust," which consists of very small ice crystals that float in the air.
For more detailed information about rainfall patterns in Cranfield, visit our Rainfall & Precipitation page.


