Average monthly rainy days in Corvara in Badia

The number of days each month with rain, snow and hail in Corvara in Badia (Trentino Alto Adige), Italy.

Average monthly rainy days in Corvara in Badia,

Feel free to add this climate graph to your website. Click the copy button above.

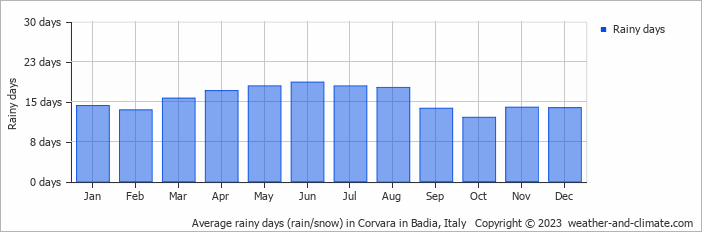
  • Most rainy days are in March, April, May, June, July and August.
  • On average, June is the most rainy with 18 days of rain/snow.
  • On average, October is the driest month with 12 rainy days.
  • The average annual number of rainy days is 185.

Weather Forecasts for Corvara in Badia

Fri   Mar 29
6°C | -3°C
S 7 km/h
0.6 mm
overcast and slight rain

overcast and slight rain

Sat   Mar 30
6°C | 0°C
S 18 km/h
13 mm
overcast and slight rain

overcast and slight rain

Sun   Mar 31
4°C | -1°C
S 11 km/h
28 mm
overcast and heavy sleet

overcast and heavy sleet

Interested in more climate information?

Weather and Climate provides you with all the information you need about the climate in Corvara in Badia.

Our site offers climate and forecast data for every country in the world. Are you going to Italy? On this website you can find historical weather averages for many cities in Italy. Not sure yet where to go? We now have a tool which recommends destinations that suit your ideal climate conditions. Find out where to go with our weather planner.