Average Rainy - Precipitation days in Chioggia
Chioggia sees 126 days of precipitation annually, totaling to 1013 mm of rain. Learn more about it on this page.
Monthly Distribution of Rainy Days
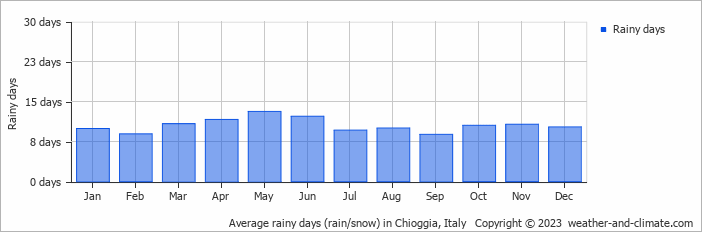
September is usually the wettest with 117 mm of rain over 9 rainy days, whereas January averages 60 mm during its 10 rainy days.
Amsterdam Precipitation Days Compared World Wide
Chioggia's average annual precipitation falls over 126 days. Let's compare this to some popular worldwide tourist destinations:
In Cairo, Egypt, there are only about 16 precipitation days annually, making it one of the driest capitals in the world.
In Kuala Lumpur, Malaysia, the city experiences around 212 precipitation days annually, consistent with its tropical rainforest climate.
In Athens, Greece, it rains around 70 days in the year; therefore, it is one of the driest Mediterranean cities, mainly dominated by winter rainfall.
Chicago, USA, has 133 precipitation days annually, with a mix of rain and snow.
In Seoul, South Korea, the city experiences 106 precipitation days annually, with most rain falling during the summer monsoon season.
Adelaide, Australia, records about 86 precipitation days per year, with dry summers and wet winters.
Fun facts about Rain from Around the World
Here are some amazing facts about rain and precipitation worldwide:
- Cherrapunji, India, records an average of 322 rainy days each year. Despite this, the wettest place is Mount Waialeale in Hawaii with 11500 mm annual rainfall.
- The fastest recorded raindrop fell at 18 meters per second during a thunderstorm in Brazil.
- The Atacama Desert in Chile is so dry that some weather stations have never recorded rainfall since their installation.
- The largest recorded raindrop measured 8.8 mm in diameter during a tropical storm on La Réunion Island.
- Some clouds can weigh up to 500,000 tons, that's equivalent to the weight of 100 elephants.
For more detailed information about rainfall patterns in Chioggia, visit our Rainfall & Precipitation page.
Current rainfall in Chioggia


