Average Rainy - Precipitation days in Chiang Rai
With 134 days and 1937 mm of annual rain, Chiang Rai has a moderate precipitation pattern. On this page, you can learn everything about the number of precipitation days.
Monthly Distribution of Rainy Days
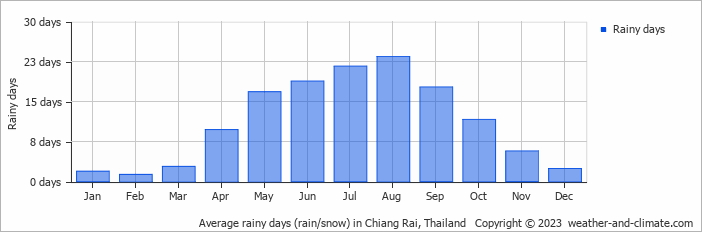
Precipitation peaks in August with 366 mm falling over 23 rainy days. The driest period is February, receiving 14 mm across a single rainy day.
Amsterdam Precipitation Days Compared World Wide
On average, Chiang Rai receives over 134 days of precipitation annually. For comparison, here is some data from popular tourist destinations around the world:In Riyadh, Saudi Arabia, there are about 29 precipitation days annually, reflecting its dry desert environment.
In Kuala Lumpur, Malaysia, the city experiences around 212 precipitation days annually, consistent with its tropical rainforest climate.
The city of Rome, Italy, averages 131 precipitation days annually, spread fairly evenly throughout the year.
Chicago, USA, has 133 precipitation days annually, with a mix of rain and snow.
In Seoul, South Korea, the city experiences 106 precipitation days annually, with most rain falling during the summer monsoon season.
In Brisbane, Australia, the city averages 123 precipitation days per year, making it wetter than Sydney.
Rain Facts From Around the Globe
Here are some amazing facts about rain and precipitation worldwide:
- Cherrapunji, India, records an average of 322 rainy days each year. Despite this, the wettest place is Mount Waialeale in Hawaii with 11500 mm annual rainfall.
- The fastest recorded raindrop fell at 18 meters per second during a thunderstorm in Brazil.
- The Atacama Desert in Chile is so dry that some weather stations have never recorded rainfall since their installation.
- The largest recorded raindrop measured 8.8 mm in diameter during a tropical storm on La Réunion Island.
- Some clouds can weigh up to 500,000 tons, that's equivalent to the weight of 100 elephants.
For more detailed information about rainfall patterns in Chiang Rai, visit our Rainfall & Precipitation page.
Current rainfall in Chiang Rai
 4 m/s
4 m/spartly cloudy and no rain
3 m/spartly cloudy and no rain
3 m/sbroken clouds and no rain


