Monthly Average Rainy days in Chandrapur
The number of days each month with rain, snow and hail in Chandrapur (Maharashtra), India.
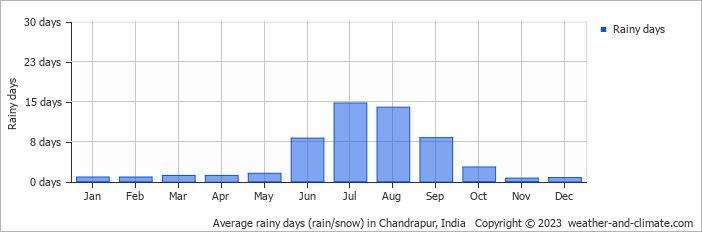
- Chandrapur has dry periods in January, February, March, April, May, November and December.
- On average, July is the most rainy with 14 days of rain/snow.
- On average, November is the driest month with 0 rainy days.
- The average annual number of rainy days is 54.
Current rainfall in Chandrapur
Tue Jan 07
30°C | 14°C
N  3 m/s
3 m/s
3 m/sclear and no rain
Wed Jan 08
29°C | 13°C
NW 2 m/s
2 m/sclear and no rain
Thu Jan 09
30°C | 12°C
N 1 m/s
1 m/salmost clear and no rain


