Monthly Average Rainy days in Cartabubbo
The number of days each month with rain, snow and hail in Cartabubbo (Sicily), Italy.
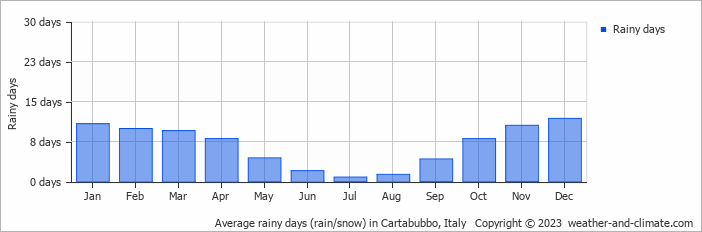
- Cartabubbo has dry periods in June, July and August.
- On average, December is the most rainy with 11 days of rain/snow.
- On average, July is the driest month with 0 rainy days.
- The average annual number of rainy days is 81.
Current rainfall in Cartabubbo
Sat Nov 23
16°C | 8°C
N  22 km/h
22 km/halmost clear and no rain
Sun Nov 24
16°C | 9°C
SE 18 km/h
18 km/halmost clear and no rain
Mon Nov 25
16°C | 10°C
SE 14 km/h
14 km/hclear and no rain


