ClimateForecastMayJune >>

Average monthly rainy days in Carnelian Bay (CA)

The number of days each month with rain, snow and hail in Carnelian Bay (California), the United States of America.

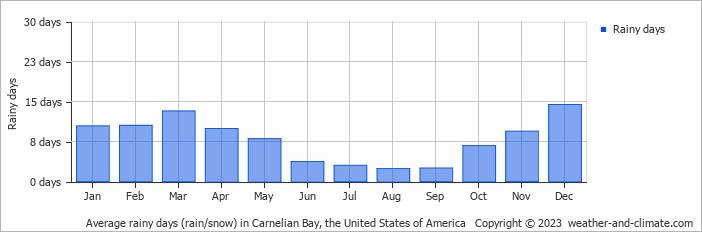
  • On average, December is the most rainy with 14 days of rain/snow.
  • On average, August is the driest month with 2 rainy days.
  • The average annual number of rainy days is 94.

Forecast for Carnelian Bay (CA)

Wed   May 08
12°C | 0°C
E 22 km/h
almost clear and no rain

almost clear and no rain

Thu   May 09
16°C | -1°C
E 22 km/h
clear and no rain

clear and no rain

Fri   May 10
18°C | -1°C
E 18 km/h
clear and no rain

clear and no rain

Interested in more climate information?

This site provides you with all the information you need about the climate in Carnelian Bay.

Our site offers climate and forecast data for every country in the world. Are you going to the United States of America? On this website you can find historical weather averages for many cities in the United States of America. Not sure yet where to go? We now have a tool which recommends destinations that suit your ideal climate conditions. Find out where to go with our weather planner.