Average Rainy - Precipitation days in Cannobio
Cannobio sees 164 days of precipitation annually, totaling to 1879 mm of rain/snow. Learn more about it on this page.
Monthly Distribution of Rainy Days
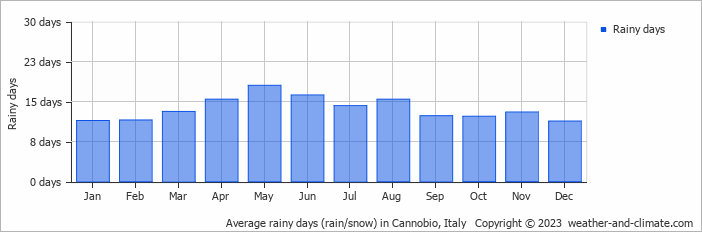
Precipitation peaks in October with 221 mm falling over 12 rainy days. The driest period is January, receiving 79 mm across 11 snowy/rainy days.
Amsterdam Precipitation Days Compared World Wide
Cannobio's average annual precipitation falls over 164 days. Let's compare this to some popular worldwide tourist destinations:
In Riyadh, Saudi Arabia, there are about 29 precipitation days annually, reflecting its dry desert environment.
In Bogotá, Colombia, there are around 188 precipitation days annually, typical for its high-altitude tropical climate.
Seville, Spain, experiences 103 precipitation days annually, with wet winters and dry summers typical of southern Spain.
Every year, the city of New York, USA, records about 130 precipitation days, with rainfall evenly distributed throughout the year.
In Seoul, South Korea, the city experiences 106 precipitation days annually, with most rain falling during the summer monsoon season.
Perth, Australia, sees approximately 103 precipitation days annually, mostly during the winter months.
Rain Facts From Around the Globe
Here are some amazing facts about rain and precipitation worldwide:
- Cherrapunji, India, records an average of 322 rainy days each year. Despite this, the wettest place is Mount Waialeale in Hawaii with 11500 mm annual rainfall.
- The fastest recorded raindrop fell at 18 meters per second during a thunderstorm in Brazil.
- The Atacama Desert in Chile is so dry that some weather stations have never recorded rainfall since their installation.
- The largest recorded raindrop measured 8.8 mm in diameter during a tropical storm on La Réunion Island.
- Some clouds can weigh up to 500,000 tons, that's equivalent to the weight of 100 elephants.
For more detailed information about rainfall patterns in Cannobio, visit our Rainfall & Precipitation page.
Current rainfall in Cannobio


