ClimateForecastAprilMay >>

Average monthly rainy days in Cabrera

The number of days each month with rain, snow and hail in Cabrera (), the Dominican Republic.

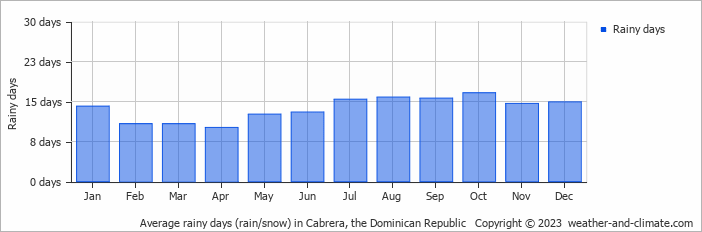
  • Most rainy days are in July, August, September and October.
  • On average, October is the most rainy with 16 days of rain/snow.
  • On average, April is the driest month with 10 rainy days.
  • The average annual number of rainy days is 164.

Weather Forecasts for Cabrera

Sun   Apr 28
27°C | 21°C
NE 29 km/h
2.5 mm
broken clouds and rain

broken clouds and rain

Mon   Apr 29
27°C | 21°C
E 25 km/h
3.8 mm
broken clouds and rain

broken clouds and rain

Tue   Apr 30
28°C | 21°C
E 22 km/h
1.7 mm
broken clouds and  chance of slight rain

broken clouds and chance of slight rain

Interested in more climate information?

Weather and Climate provides you with all the information you need about the climate in Cabrera.

Our site offers climate and forecast data for every country in the world. Are you going to the Dominican Republic? On this website you can find historical weather averages for many cities in the Dominican Republic. Not sure yet where to go? We now have a tool which recommends destinations that suit your ideal climate conditions. Find out where to go with our weather planner.