ClimateForecastAprilMay >>

Average monthly rainy days in Càbras

The number of days each month with rain, snow and hail in Càbras (Sardinia), Italy.

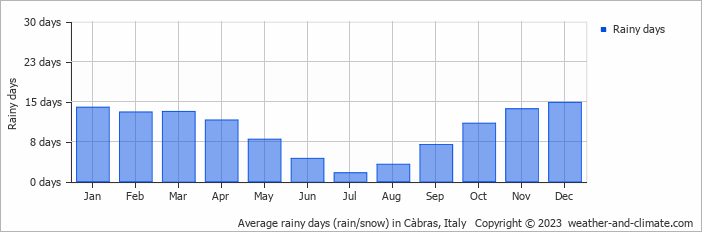
  • On average, December is the most rainy with 14 days of rain/snow.
  • On average, July is the driest month with 1 rainy day.
  • The average annual number of rainy days is 114.

Weather Forecasts for Càbras

Tue   Apr 30
26°C | 14°C
SE 25 km/h
3.3 mm
broken clouds and rain

broken clouds and rain

Wed   May 01
21°C | 14°C
SW 25 km/h
26 mm
partly cloudy and rain

partly cloudy and rain

Thu   May 02
20°C | 12°C
SW 22 km/h
16 mm
partly cloudy and thunder

partly cloudy and thunder

Interested in more climate information?

Weather and Climate provides you with all the information you need about the climate in Càbras.

Our site offers climate and forecast data for every country in the world. Are you going to Italy? On this website you can find historical weather averages for many cities in Italy. Not sure yet where to go? We now have a tool which recommends destinations that suit your ideal climate conditions. Find out where to go with our weather planner.