Monthly Average Rainy days in Burney (CA)
The number of days each month with rain, snow and hail in Burney (California), the United States of America.
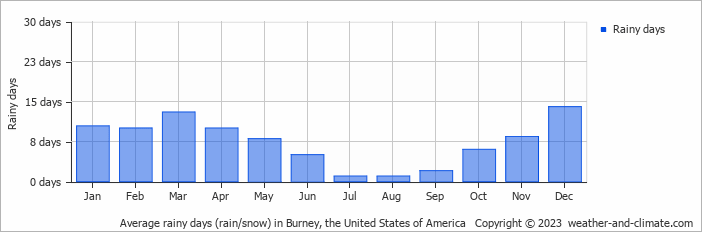
- Burney has dry periods in July, August and September.
- On average, December is the most rainy with 14 days of rain/snow.
- On average, July is the driest month with 1 rainy day.
- The average annual number of rainy days is 88.
Current rainfall in Burney (CA)
Tue Nov 26
6°C | -5°C
W  11 km/h
11 km/h17 mm
partly cloudy and chance of rain
Wed Nov 27
5°C | -7°C
SE 4 km/h
4 km/hclear and no rain
Thu Nov 28
7°C | -9°C
SE 4 km/h
4 km/hclear and no rain


