Monthly Average Rainy days in Burgberg
The number of days each month with rain, snow and hail in Burgberg (Bavaria), Germany.
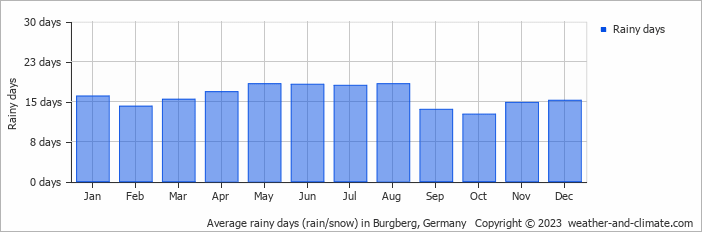
- Most rainy days are in January, March, April, May, June, July, August and December.
- On average, August is the most rainy with 18 days of rain/snow.
- On average, October is the driest month with 12 rainy days.
- The average annual number of rainy days is 191.
Current rainfall in Burgberg
Sun Dec 22
4°C | -3°C
SW  3 m/s
3 m/s
3 m/s49 mm
overcast and heavy rain
Mon Dec 23
0°C | -5°C
W 2 m/s
2 m/s26 mm
overcast and heavy snow
Tue Dec 24
-2°C | -12°C
SW 2 m/s
2 m/s8.7 mm
overcast and snow