Average Rainy - Precipitation days in Brusson
Brusson sees 186 days of precipitation annually, totaling to 1554 mm of rain/snow. Learn more about it on this page.
Monthly Distribution of Rainy Days
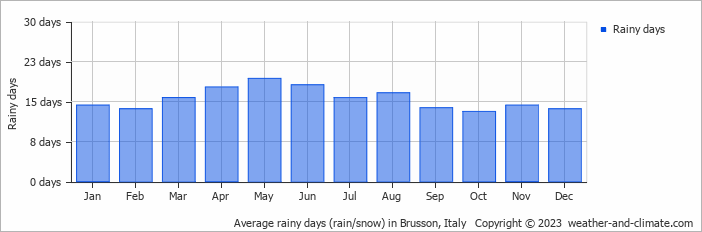
Precipitation peaks in May with 170 mm falling over 19 rainy days. The driest period is February, receiving 76 mm across 14 snowy days.
Amsterdam Precipitation Days Compared World Wide
Brusson's average annual precipitation falls over 186 days. Let's compare this to some popular worldwide tourist destinations:
In Riyadh, Saudi Arabia, there are about 29 precipitation days annually, reflecting its dry desert environment.
In Bogotá, Colombia, there are around 188 precipitation days annually, typical for its high-altitude tropical climate.
In Athens, Greece, it rains around 70 days in the year; therefore, it is one of the driest Mediterranean cities, mainly dominated by winter rainfall.
The climate in San Francisco, USA, sees around 70 precipitation days annually, mostly during the winter months.
In Seoul, South Korea, the city experiences 106 precipitation days annually, with most rain falling during the summer monsoon season.
Perth, Australia, sees approximately 103 precipitation days annually, mostly during the winter months.
Rain Facts From Around the Globe
Here are some amazing facts about rain and precipitation worldwide:
- Cherrapunji, India, records an average of 322 rainy days each year. Despite this, the wettest place is Mount Waialeale in Hawaii with 11500 mm annual rainfall.
- The fastest recorded raindrop fell at 18 meters per second during a thunderstorm in Brazil.
- The Atacama Desert in Chile is so dry that some weather stations have never recorded rainfall since their installation.
- The largest recorded raindrop measured 8.8 mm in diameter during a tropical storm on La Réunion Island.
- Some clouds can weigh up to 500,000 tons, that's equivalent to the weight of 100 elephants.
For more detailed information about rainfall patterns in Brusson, visit our Rainfall & Precipitation page.
Current rainfall in Brusson


