Monthly Average Rainy days in Brea (CA)
The number of days each month with rain, snow and hail in Brea (California), the United States of America.
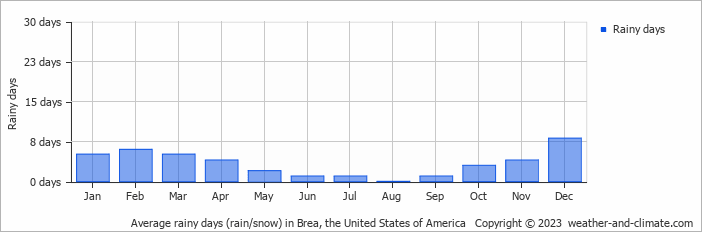
- Brea has dry periods in May, June, July, August and September.
- On average, December is the most rainy with 8 days of rain/snow.
- On average, August is the driest month with 0 rainy days.
- The average annual number of rainy days is 40.
Current rainfall in Brea (CA)
Tue Nov 26
21°C | 12°C
SW  11 km/h
11 km/hpartly cloudy and no rain
Wed Nov 27
21°C | 11°C
SW 7 km/h
7 km/h0.2 mm
partly cloudy and small chance of slight rain
Thu Nov 28
25°C | 10°C
N 7 km/h
7 km/halmost clear and no rain


