Average Rainy - Precipitation days in Brædstrup
Over the course of the year, Brædstrup experiences 798 mm of rain/snow across 177 days. On this page you will discover more about the number of precipitation days.
Monthly Distribution of Rainy Days
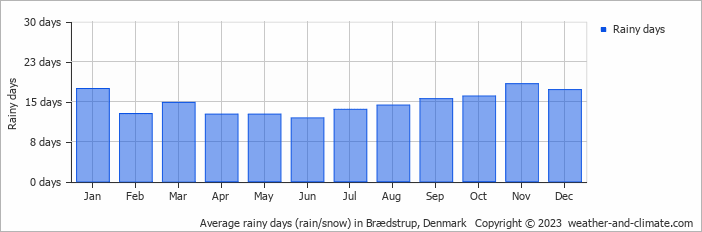
The wettest month is August, with 14 rainy days bringing 82 mm of rain. In contrast, April sees 13 rainy days with 52 mm of rain.
Amsterdam Precipitation Days Compared World Wide
On average, Brædstrup receives over 177 days of precipitation annually. For comparison, here is some data from popular tourist destinations around the world:In Cairo, Egypt, there are only about 16 precipitation days annually, making it one of the driest capitals in the world.
Singapore, Singapore, records about 175 precipitation days per year, with rain spread fairly evenly throughout the year.
The city of Rome, Italy, averages 131 precipitation days annually, spread fairly evenly throughout the year.
Every year, the city of New York, USA, records about 130 precipitation days, with rainfall evenly distributed throughout the year.
In Shanghai, China, there are approximately 147 precipitation days per year, with a humid subtropical climate.
In Brisbane, Australia, the city averages 123 precipitation days per year, making it wetter than Sydney.
Fun facts about Rain from Around the World
Let’s explore more fascinating precipitation records:
- Tutunendo, Colombia, gets about 340 days of rain every year, which arguably makes it the wettest place in the world.
- On Réunion Island, a tropical cyclone generated 1825 mm in just 24 hours.
- Singapore receives thunder on 167 days in the year and is considered one of the most thunderous cities in the world.
- The smallest drops that fall are called drizzle drops, and they have a diameter of 0.5 mm.
- Some heavy storms generate "diamond dust," which consists of very small ice crystals that float in the air.
For more detailed information about rainfall patterns in Brædstrup, visit our Rainfall & Precipitation page.
Current rainfall in Brædstrup


