ClimateForecastAprilMay >>

Average monthly rainy days in Ban Rong

The number of days each month with rain, snow and hail in Ban Rong (Chiang Mai Province), Thailand.

Average monthly rainy days in Ban Rong,

Feel free to add this climate graph to your website. Click the copy button above.

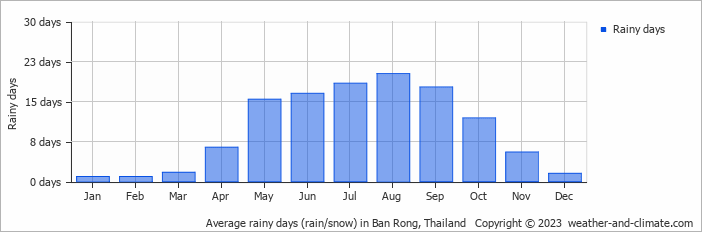
  • Most rainy days are in May, June, July, August and September.
  • Ban Rong has dry periods in January, February, March and December.
  • On average, August is the most rainy with 20 days of rain/snow.
  • On average, January is the driest month with 0 rainy days.
  • The average annual number of rainy days is 116.

Weather Forecasts for Ban Rong

Tue   Apr 16
40°C | 26°C
SW 7 km/h
almost clear and no rain

almost clear and no rain

Wed   Apr 17
40°C | 26°C
SW 14 km/h
almost clear and no rain

almost clear and no rain

Thu   Apr 18
40°C | 26°C
S 7 km/h
almost clear and no rain

almost clear and no rain

Interested in more climate information?

Weather and Climate provides you with all the information you need about the climate in Ban Rong.

Our site offers climate and forecast data for every country in the world. Are you going to Thailand? On this website you can find historical weather averages for many cities in Thailand. Not sure yet where to go? We now have a tool which recommends destinations that suit your ideal climate conditions. Find out where to go with our weather planner.