Monthly Average Rainy days in Ban Pong
The number of days each month with rain, snow and hail in Ban Pong (), Thailand.
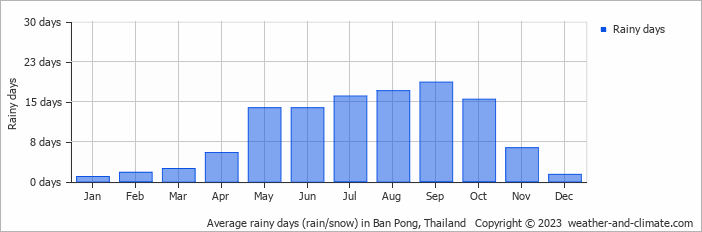
- Most rainy days are in July, August, September and October.
- Ban Pong has dry periods in January, February and December.
- On average, September is the most rainy with 18 days of rain/snow.
- On average, January is the driest month with 0 rainy days.
- The average annual number of rainy days is 112.
Current rainfall in Ban Pong
Wed Jan 15
30°C | 16°C
N  4 m/s
4 m/s
4 m/sclear and no rain
Thu Jan 16
30°C | 20°C
N 3 m/s
3 m/salmost clear and no rain
Fri Jan 17
30°C | 19°C
N 3 m/s
3 m/sclear and no rain


