Average Rainy - Precipitation days in Ban Pong
Ban Pong sees 109 days of precipitation annually, totaling to 1354 mm of rain. Learn more about it on this page.
Monthly Distribution of Rainy Days
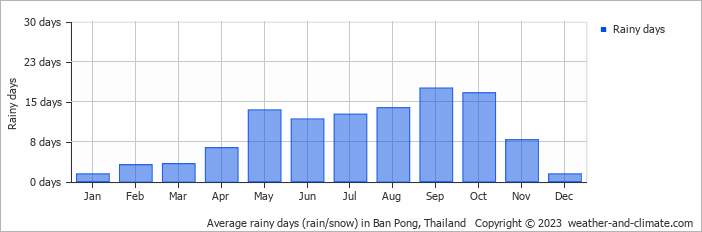
September is usually the wettest with 246 mm of rain over 18 rainy days, whereas December averages 16 mm during its a single rainy day.
Amsterdam Precipitation Days Compared World Wide
Ban Pong's average annual precipitation falls over 109 days. Let's compare this to some popular worldwide tourist destinations:
In Cairo, Egypt, there are only about 16 precipitation days annually, making it one of the driest capitals in the world.
Singapore, Singapore, records about 175 precipitation days per year, with rain spread fairly evenly throughout the year.
In Lisbon, Portugal, there are an average of 113 precipitation days annually, characterized by wet winters and dry summers typical of the Mediterranean climate.
Every year, the city of New York, USA, records about 130 precipitation days, with rainfall evenly distributed throughout the year.
In Shanghai, China, there are approximately 147 precipitation days per year, with a humid subtropical climate.
Perth, Australia, sees approximately 103 precipitation days annually, mostly during the winter months.
Fun facts about Rain from Around the World
Let’s explore more fascinating precipitation records:
- Tutunendo, Colombia, gets about 340 days of rain every year, which arguably makes it the wettest place in the world.
- On RĂ©union Island, a tropical cyclone generated 1825 mm in just 24 hours.
- Singapore receives thunder on 167 days in the year and is considered one of the most thunderous cities in the world.
- The smallest drops that fall are called drizzle drops, and they have a diameter of 0.5 mm.
- Some heavy storms generate "diamond dust," which consists of very small ice crystals that float in the air.
For more detailed information about rainfall patterns in Ban Pong, visit our Rainfall & Precipitation page.
Current rainfall in Ban Pong


