Monthly Average Rainy days in Ban Mae Pong
The number of days each month with rain, snow and hail in Ban Mae Pong (Chiang Mai Province), Thailand.
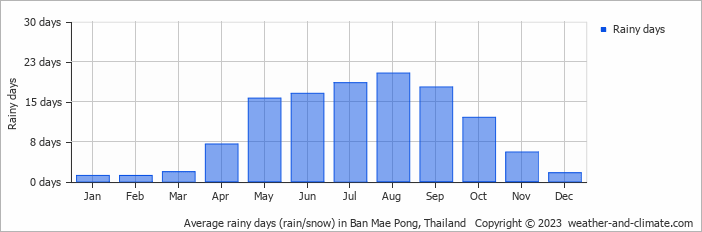
- Most rainy days are in May, June, July, August and September.
- Ban Mae Pong has dry periods in January, February, March and December.
- On average, August is the most rainy with 20 days of rain/snow.
- On average, January is the driest month with 1 rainy day.
- The average annual number of rainy days is 118.
Current rainfall in Ban Mae Pong
Thu Nov 21
31°C | 20°C
SW  4 km/h
4 km/halmost clear and no rain
Fri Nov 22
31°C | 19°C
S 7 km/h
7 km/h0.3 mm
partly cloudy and small chance of slight rain
Sat Nov 23
31°C | 19°C
SW 7 km/h
7 km/hclear and no rain


