ClimateForecastAprilMay >>

Average monthly rainy days in Bad Buchau

The number of days each month with rain, snow and hail in Bad Buchau (Baden-Württemberg), Germany.

Average monthly rainy days in Bad Buchau,

Feel free to add this climate graph to your website. Click the copy button above.

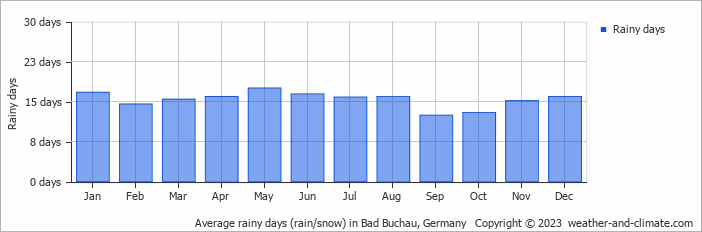
  • Most rainy days are in January, March, April, May, June, July, August, November and December.
  • On average, May is the most rainy with 17 days of rain/snow.
  • On average, September is the driest month with 12 rainy days.
  • The average annual number of rainy days is 184.

Weather Forecasts for Bad Buchau

Tue   Apr 16
9°C | 2°C
W 29 km/h
4.3 mm
broken clouds and slight rain

broken clouds and slight rain

Wed   Apr 17
8°C | 2°C
NW 14 km/h
9.5 mm
overcast and heavy rain

overcast and heavy rain

Thu   Apr 18
8°C | -1°C
N 14 km/h
2.6 mm
overcast and sleet

overcast and sleet

Interested in more climate information?

Weather and Climate provides you with all the information you need about the climate in Bad Buchau.

Our site offers climate and forecast data for every country in the world. Are you going to Germany? On this website you can find historical weather averages for many cities in Germany. Not sure yet where to go? We now have a tool which recommends destinations that suit your ideal climate conditions. Find out where to go with our weather planner.