Monthly Average Rainy days in Al Qaşr
The number of days each month with rain, snow and hail in Al Qaşr (New Valley ), Egypt.
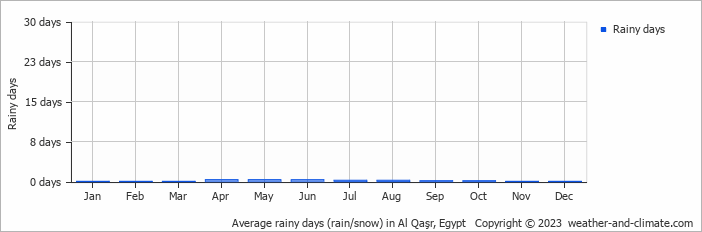
- Al Qaşr has dry periods in January, February, March, April, May, June, July, August, September, October, November and December.
- On average, May is the most rainy with 0 days of rain/snow.
- On average, January is the driest month with 0 rainy days.
- The average annual number of rainy day is 1.
Current rainfall in Al Qaşr
Sun Nov 17
26°C | 11°C
N  18 km/h
18 km/hclear and no rain
Mon Nov 18
23°C | 11°C
N 11 km/h
11 km/hclear and no rain
Tue Nov 19
24°C | 10°C
N 14 km/h
14 km/hclear and no rain