Monthly Average Rainy days in Al Mikhlaf
The number of days each month with rain, snow and hail in Al Mikhlaf (), Saudi Arabia.
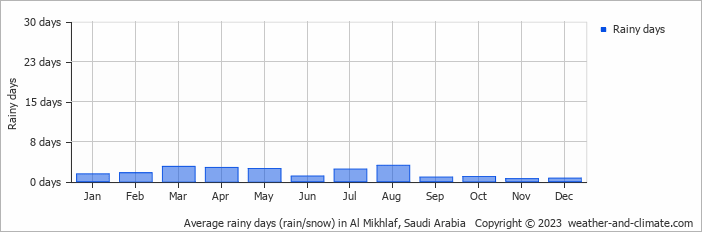
- Al Mikhlaf has dry periods in January, February, June, September, October, November and December.
- On average, August is the most rainy with 3 days of rain/snow.
- On average, November is the driest month with 0 rainy days.
- The average annual number of rainy days is 19.
Current rainfall in Al Mikhlaf
Mon Jan 06
26°C | 6°C
E  5 m/s
5 m/s
5 m/salmost clear and no rain
Tue Jan 07
27°C | 10°C
NE 4 m/s
4 m/spartly cloudy and no rain
Wed Jan 08
24°C | 9°C
NE 5 m/s
5 m/sclear and no rain


