Monthly Average Rainy days in Al Fayşalīyah
The number of days each month with rain, snow and hail in Al Fayşalīyah (), Saudi Arabia.
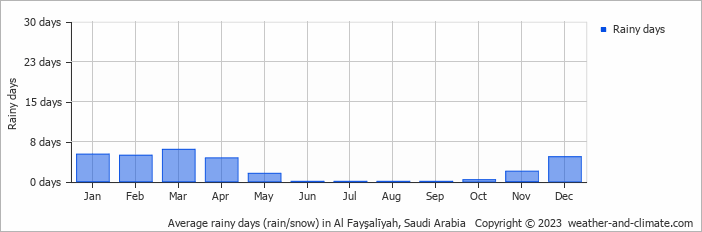
- Al Fayşalīyah has dry periods in May, June, July, August, September, October and November.
- On average, March is the most rainy with 6 days of rain/snow.
- On average, August is the driest month with 0 rainy days.
- The average annual number of rainy days is 28.
Current rainfall in Al Fayşalīyah
Tue Dec 03
24°C | 13°C
N  11 km/h
11 km/hclear and no rain
Wed Dec 04
25°C | 14°C
NE 7 km/h
7 km/hclear and no rain
Thu Dec 05
27°C | 14°C
E 7 km/h
7 km/hclear and no rain


