Monthly Average Rainy days in Puerto Cabezas
The number of days each month with rain, snow and hail in Puerto Cabezas (), Nicaragua.
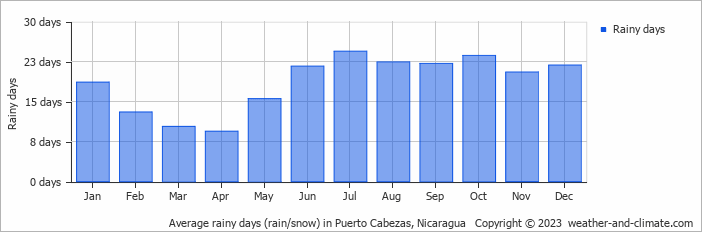
- Most rainy days are in January, May, June, July, August, September, October, November and December.
- On average, July is the most rainy with 24 days of rain/snow.
- On average, April is the driest month with 9 rainy days.
- The average annual number of rainy days is 223.
Current rainfall in Puerto Cabezas
Sat Dec 14
31°C | 23°C
NE  29 km/h
29 km/h0.3 mm
partly cloudy and chance of slight rain
Sun Dec 15
30°C | 22°C
NE 29 km/h
29 km/h0.3 mm
partly cloudy and small chance of slight rain
Mon Dec 16
31°C | 22°C
N 25 km/h
25 km/h1.6 mm
partly cloudy and rain