Monthly Average Rainy days in La Orchila
The number of days each month with rain, snow and hail in La Orchila (), Venezuela.
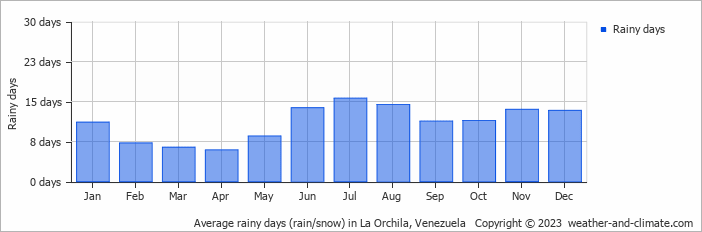
- Most rainy days are in July.
- On average, July is the most rainy with 15 days of rain/snow.
- On average, April is the driest month with 5 rainy days.
- The average annual number of rainy days is 132.
Current rainfall in La Orchila
Tue Dec 03
31°C | 27°C
E  32 km/h
32 km/h0.9 mm
partly cloudy and small chance of slight rain
Wed Dec 04
31°C | 26°C
E 40 km/h
40 km/h5.3 mm
partly cloudy and rain
Thu Dec 05
30°C | 27°C
NE 36 km/h
36 km/h1.2 mm
partly cloudy and chance of rain