Average monthly rainy days in Kikwit

The number of days each month with rain, snow and hail in Kikwit (), Democratic Republic of the Congo.

Average monthly rainy days in Kikwit,

Feel free to add this climate graph to your website. Click the copy button above.

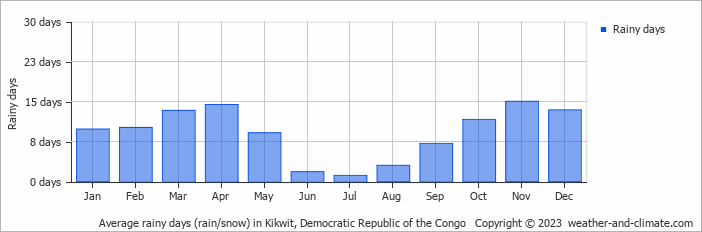
  • Most rainy days are in November.
  • Kikwit has dry periods in June and July.
  • On average, November is the most rainy with 15 days of rain/snow.
  • On average, July is the driest month with 1 rainy day.
  • The average annual number of rainy days is 109.

Weather Forecasts for Kikwit

Thu   Mar 28
36°C | 22°C
S 7 km/h
0.6 mm
broken clouds and small chance of rain

broken clouds and small chance of rain

Fri   Mar 29
35°C | 23°C
NW 7 km/h
8.5 mm
broken clouds and thunder

broken clouds and thunder

Sat   Mar 30
31°C | 23°C
N 4 km/h
13 mm
broken clouds and thunder

broken clouds and thunder

Interested in more climate information?

Weather and Climate provides you with all the information you need about the climate in Kikwit.

Our site offers climate and forecast data for every country in the world. Are you going to Democratic Republic of the Congo? On this website you can find historical weather averages for many cities in Democratic Republic of the Congo. Not sure yet where to go? We now have a tool which recommends destinations that suit your ideal climate conditions. Find out where to go with our weather planner.