Average Rainy - Precipitation days in Karup
Over the course of the year, Karup experiences 846 mm of rain/snow across 184 days. On this page you will discover more about the number of precipitation days.
Monthly Distribution of Rainy Days
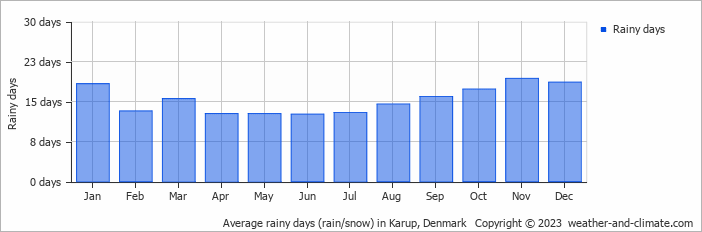
August is usually the wettest with 86 mm of rain over 15 rainy days, whereas April averages 55 mm during its 13 rainy days.
Amsterdam Precipitation Days Compared World Wide
Karup's average annual precipitation falls over 184 days. Let's compare this to some popular worldwide tourist destinations:
Las Vegas, USA, gets about 26 precipitation days annually, which is typical for its arid desert climate.
In Kuala Lumpur, Malaysia, the city experiences around 212 precipitation days annually, consistent with its tropical rainforest climate.
In Lisbon, Portugal, there are an average of 113 precipitation days annually, characterized by wet winters and dry summers typical of the Mediterranean climate.
Chicago, USA, has 133 precipitation days annually, with a mix of rain and snow.
In Seoul, South Korea, the city experiences 106 precipitation days annually, with most rain falling during the summer monsoon season.
Melbourne, Australia, has about 120 precipitation days annually, spread fairly evenly throughout the year.
Fun facts about Rain from Around the World
Here are some amazing facts about rain and precipitation worldwide:
- Cherrapunji, India, records an average of 322 rainy days each year. Despite this, the wettest place is Mount Waialeale in Hawaii with 11500 mm annual rainfall.
- The fastest recorded raindrop fell at 18 meters per second during a thunderstorm in Brazil.
- The Atacama Desert in Chile is so dry that some weather stations have never recorded rainfall since their installation.
- The largest recorded raindrop measured 8.8 mm in diameter during a tropical storm on La Réunion Island.
- Some clouds can weigh up to 500,000 tons, that's equivalent to the weight of 100 elephants.
For more detailed information about rainfall patterns in Karup, visit our Rainfall & Precipitation page.


