Monthly Average Rainy days in Honolulu (HI)
The number of days each month with rain, snow and hail in Honolulu (Hawaii), the United States of America.
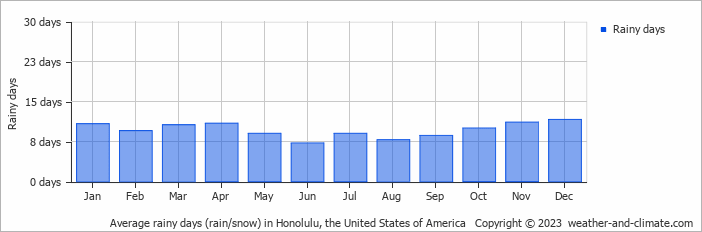
- On average, December is the most rainy with 11 days of rain/snow.
- On average, June is the driest month with 7 rainy days.
- The average annual number of rainy days is 116.
Current rainfall in Honolulu (HI)
Mon Dec 23
29°C | 23°C
NE  8 m/s
8 m/s
8 m/s0.3 mm
partly cloudy and small chance of slight rain
Tue Dec 24
29°C | 24°C
NE 5 m/s
5 m/s0.6 mm
broken clouds and small chance of slight rain
Wed Dec 25
29°C | 22°C
E 7 m/s
7 m/s0.2 mm
partly cloudy and small chance of slight rain


