Gig Harbor (WA) Climate by Month
The graphs below provide an overview of the climate in Gig Harbor (Washington State), the United States of America. They present long-term patterns and averages of weather conditions over a 30-year period.
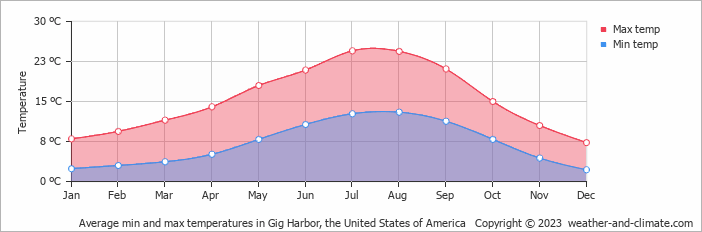
Average day and night temperature
The mean minimum and maximum temperatures over the year.
Monthly hours of sunshine
The average monthly total hours of sunshine over the year
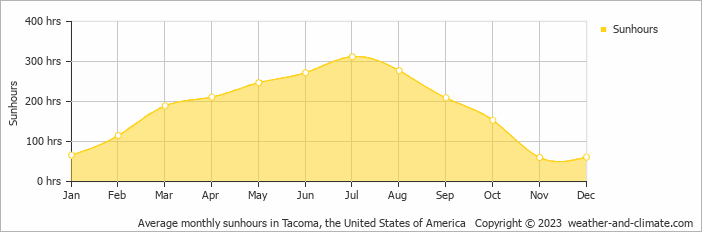
* Data from: Tacoma, the United States of America (14 KM, 8 Miles).
Daily percent of sunshine
The mean percent of hours of sunhours during the day over the year
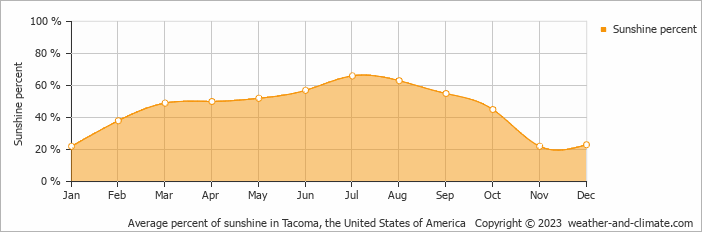
* Data from: Tacoma, the United States of America (14 KM, 8 Miles).
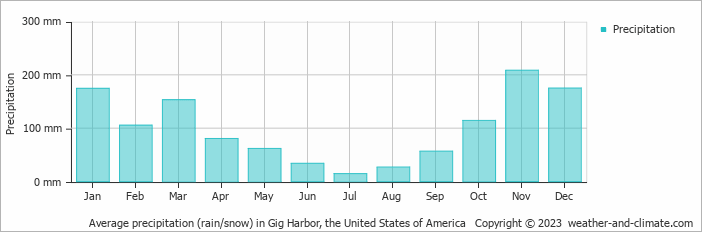
Monthly precipitation
The mean monthly precipitation over the year, including rain, snow, hail etc.
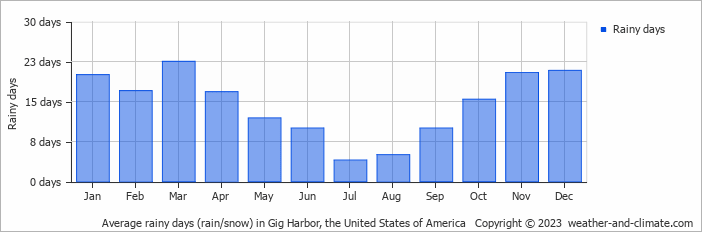
Monthly rainy days
The average number of days each month with rain, snow, hail etc.