Zaton Doli Weather & Climate: Best Time to Visit
Average temperatures, rainfall, sunshine and the best time to visit Zaton Doli.
Climate overview of Zaton Doli
Zaton Doli, Dubrovnik-Neretva County, Croatia, experiences significant temperature variation throughout the year. Summers bring daytime highs of 29°C (84°F) in August, while winters cool to 11°C (52°F) in January.
The city has a wet climate, receiving around 1637 mm (64 in) of rainfall per year. Despite the high annual total, it has a distinct rainy season from October to December, with warm summers and cold winters. November is the wettest month. The most sunshine falls in July, with an average of 11.5 hours of daily sunshine.
Zaton Doli Weather by Month
Pick a month to see the average temperature, rainfall and sunshine in Zaton Doli - and find the best time to visit.
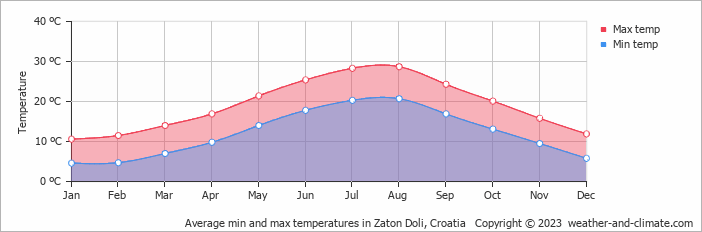
Monthly Temperature in Zaton Doli
Depending on the time of the year, temperatures range from comfortable to chilly in Zaton Doli. On average, daytime temperatures range from a comfortable 29°C (84°F) in August to a chilly 11°C (52°F) in January.
Nighttime temperatures range from 21°C (70°F) in August to 5°C (41°F) in January.
Check out our detailed temperature page for more information.
Temperature ranges by month
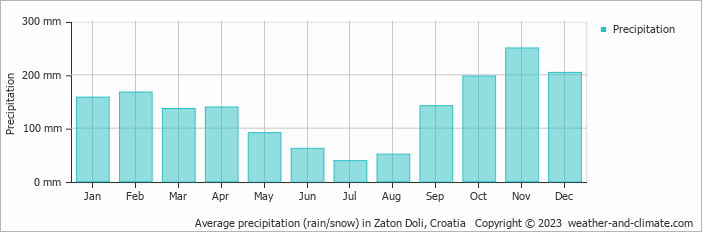
Rainfall in Zaton Doli
Zaton Doli has a relatively rainy climate with high precipitation levels, averaging 1637 mm (64 in) of rainfall annually. The seasons in Zaton Doli bring significant changes in precipitation. The wettest month, November, receives heavy rainfall, with an average of 250 mm (9.8 in) of precipitation. This rainfall is distributed across 13 rainy days.
In contrast, the driest month, July, experiences much less rainfall, totaling 39 mm (1.5 in) over 7 rainy days. These distinct seasonal differences provide diverse experiences throughout the year. For more details, please visit our Zaton Doli Precipitation page.
The mean monthly precipitation over the year, including rain, hail, and snow
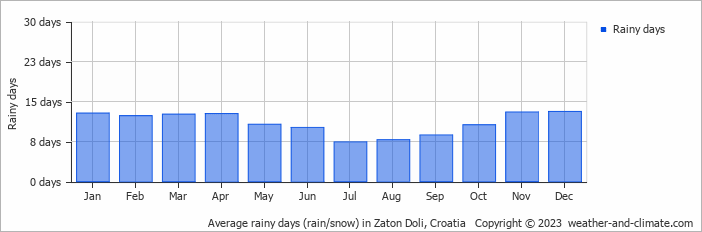
The average number of days each month with precipitation
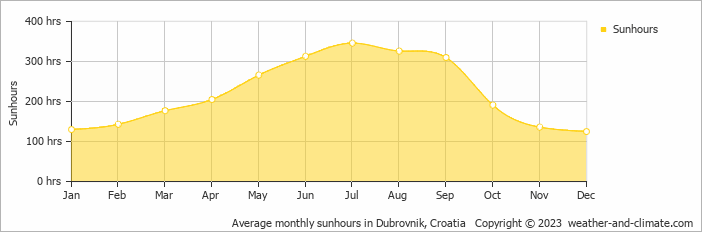
Sunshine Hours in Zaton Doli
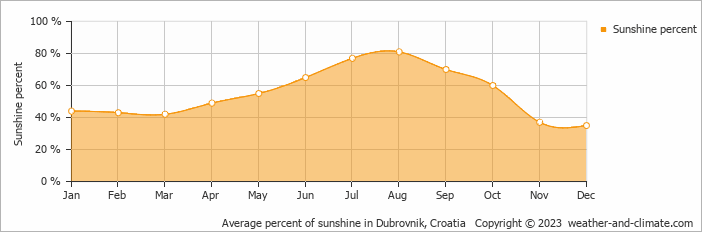
In Zaton Doli, summer days are longer and more sunny, with daily sunshine hours peaking at 11.5 hours in July. As the darker season arrives, the brightness of the sun becomes less. December sees a soft sun for only 4.2 hours per average day.
Visit our detailed sunshine hours page for more information.
Monthly hours of sunshine
Daily hours of sunshine
Daily percentage of sunshine
Water Temperature in Zaton Doli
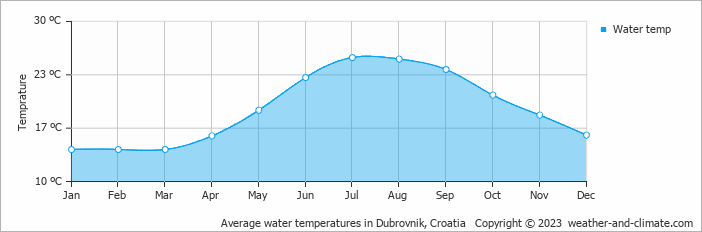
The mean water temperature over the year ranges from 14°C (57°F) in January to 26°C (79°F) in July.
Water temperature over the year
Humidity in Zaton Doli by Month
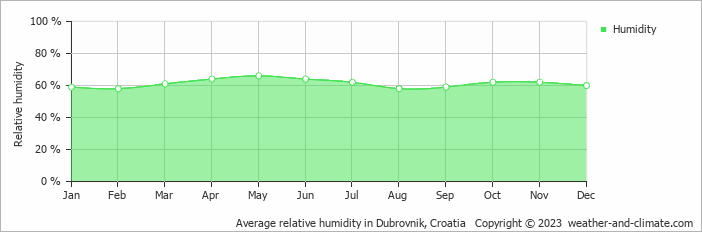
The relative humidity is high throughout the year in Zaton Doli.
The city experiences its highest humidity in May, reaching 66%. In February, the humidity drops to its lowest level at 58%. What does this mean? Read our detailed page on humidity levels for further details.
Relative humidity over the year
Best Time to Visit Zaton Doli
Monthly ratings reflect general weather comfort, based on daytime temperature and rainfall. Swimming and winter conditions are highlighted separately where relevant.
- Best overall: May, June, July and August
- Warmest weather: July and August
- Most sunshine: July
- Fewest rainy days: July, August and September
- Best for swimming: June, July, August, September and October.
- Wettest months: January, February, September, October, November and December, when rainfall is highest.
- Seasonal pattern: A distinct rainy season from October to December, with warm summers and cold winters
Frequently asked questions about the climate in Zaton Doli
What is the best time to visit Zaton Doli?
May, June, July and August typically offer the most optimal weather in Zaton Doli. In contrast, January, February, November and December tend to have less optimal conditions. Zaton Doli has a distinct rainy season from October to December, with warm summers and cold winters.
What temperatures can I expect in Zaton Doli?
Daytime highs range from 11°C (52°F) in January to 29°C (84°F) in August. Nighttime lows range from 5°C (41°F) to 21°C (70°F). Temperatures vary considerably through the year.
How much rain does Zaton Doli get?
Annual rainfall is around 1637 mm (64 in). November is the wettest month with 250 mm (9.8 in), while July is the driest with 39 mm (1.5 in).
How sunny is Zaton Doli?
Zaton Doli receives around 2,668 hours of sunshine per year. July is the sunniest month with 346 hours, while December is the cloudiest with just 125 hours. Overall, Zaton Doli enjoys abundant sunshine.
Zaton Doli 3-Day Forecast
Zaton Doli 3-Day Forecast
Zaton Doli on the map
Zaton Doli is highlighted - select any city to see its climate.
Popular this month
Where to go in July - average daytime high across popular destinations.
Bucket list
Need travel inspiration? Check out our bucket list articles and be inspired.
 Magical Split
The best travel time to Split in Croatia is from May til October and the best months are May, June and September.
Sail the crystal-clear waters of Croatia and enjoy its stunning coastline
Croatia is an idyllic sailing destination, boasting 1,777 miles (2,860 km) of beautiful beaches and pristine waters. With over 1,000 Islands dotting the Adriatic Sea, there's a perfect spot for everyone.
 Cycle the Danube trail
The Danube cycle route is one of the most popular cycling routes in Europe, and rightly so, because it is a varied route that is interesting both in terms of culture and nature.