Velika Gorica Weather & Climate: Best Time to Visit
Average temperatures, rainfall, sunshine and the best time to visit Velika Gorica.
Climate overview of Velika Gorica
Velika Gorica, Zagreb County, Croatia, experiences significant temperature variation throughout the year. Summers bring daytime highs of 30°C (86°F) in July, while winters cool to 6°C (43°F) in January.
Velika Gorica sees a moderate amount of rain/snowfall, totalling around 943 mm (37 in) per year. The sunniest month is July, with 9.3 hours of sunshine per day on average.
Velika Gorica Weather by Month
Pick a month to see the average temperature, rainfall and sunshine in Velika Gorica — and find the best time to visit.
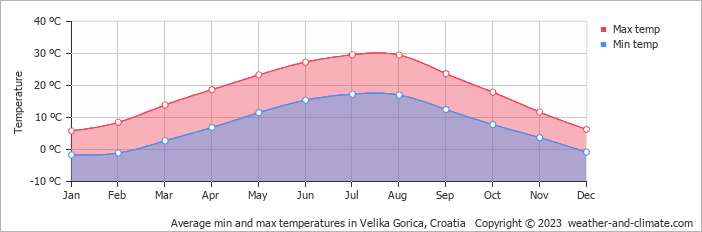
Monthly Temperature in Velika Gorica
Depending on the time of the year, temperatures range from comfortable to chilly in Velika Gorica. Average maximum daytime temperatures range from a comfortable 30°C (86°F) in July, the warmest time of the year, to a chilly 6°C (43°F) during cooler months like January.
At night, you can expect temperatures ranging from 17°C (63°F) in July to around -2°C (28°F) during January.
Check out our detailed temperature page for more information.
Temperature ranges by month
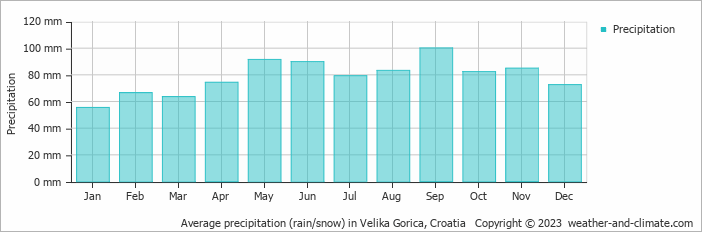
Rainfall in Velika Gorica
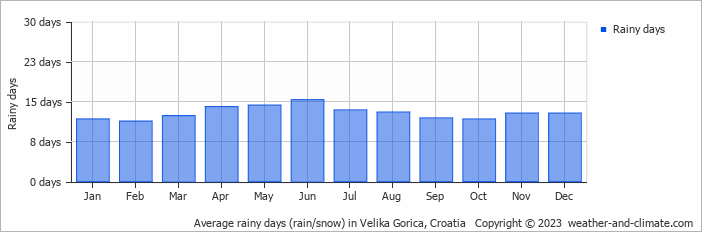
Generally, Velika Gorica has a moderate amount of precipitation, averaging 943 mm (37 in) of rain/snowfall annually. While rainfall varies throughout the year, each season offers its own charm. September brings wetter days averaging 100 mm (3.9 in) of precipitation, spread over 12 rainy days.
In contrast, the driest month January experiences a drier climate, with about 55 mm (2.2 in) of snow/rainfall spread across 12 snowy/rainy days. For more details, please visit our Velika Gorica Precipitation page.
The mean monthly precipitation over the year, including rain, hail, and snow
The average number of days each month with precipitation
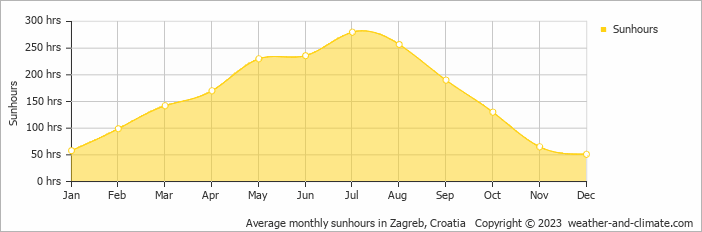
Sunshine Hours in Velika Gorica
Seasonal changes in sunshine hours are quite dramatic in Velika Gorica. While July receives considerable daily sunshine with up to 9.3 hours, December marks the darkest time of the year, where sunshine is scarce with only 1.7 hours of sunlight per day.
Visit our detailed sunshine hours page for more information.
Monthly hours of sunshine
Daily hours of sunshine
Daily percentage of sunshine
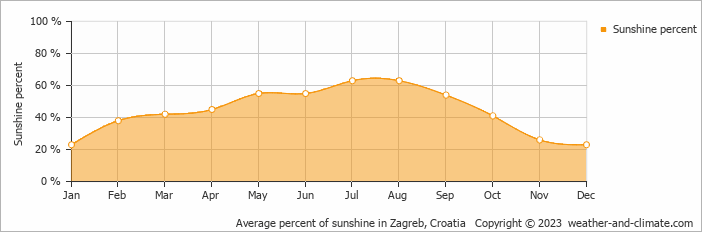
Humidity in Velika Gorica by Month
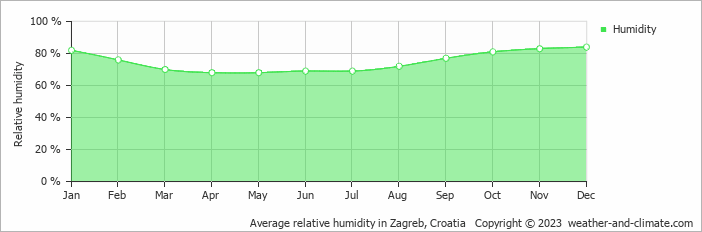
The relative humidity is high throughout the year in Velika Gorica.
The city experiences its highest humidity in December, reaching 84%. In April, the humidity drops to its lowest level at 68%. What does this mean? Read our detailed page on humidity levels for further details.
Relative humidity over the year
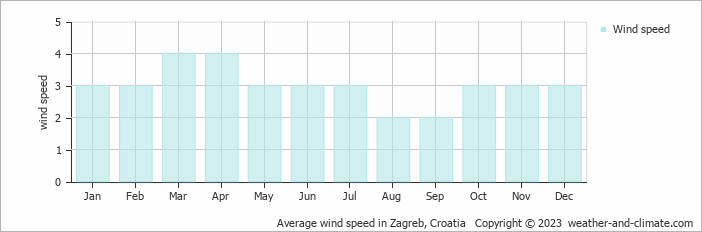
Wind Speed in Velika Gorica
The average wind speed over the year ranges from 2 m/s (4 knots) to 4 m/s (8 knots). It is lower in August and September and higher in March and April. What does this mean?
The mean monthly wind speed over the year (meters per second)
Best Time to Visit Velika Gorica
Rainfall during this time ranges from 74 mm (2.9 in) in April to 100 mm (3.9 in) in September. This means you can expect a mix of sunny days and occasional showers. Looking for inspiration on where to travel this year? We have a tool that recommends destinations based on your ideal conditions. Find out where to go with our weather planner.
Frequently asked questions about the climate in Velika Gorica
What is the best time to visit Velika Gorica?
May and June typically offer the most optimal weather in Velika Gorica. In contrast, January, February and December tend to have less optimal conditions.
What temperatures can I expect in Velika Gorica?
Daytime highs range from 6°C (43°F) in January to 30°C (86°F) in July. Nighttime lows range from -2°C (28°F) to 17°C (63°F). Temperatures vary considerably through the year.
How much rain does Velika Gorica get?
Annual rainfall is around 943 mm (37 in). September is the wettest month with 100 mm (3.9 in), while January is the driest with 55 mm (2.2 in).
How sunny is Velika Gorica?
Velika Gorica receives around 1,908 hours of sunshine per year. July is the sunniest month with 280 hours, while December is the cloudiest with just 51 hours.
Velika Gorica 3-Day Forecast
Velika Gorica 3-Day Forecast
Velika Gorica on the map
Velika Gorica is highlighted — select any city to see its climate.
Popular this month
Where to go in July — average daytime high across popular destinations.
Bucket list
Need travel inspiration? Check out our bucket list articles and be inspired.
 Magical Split
The best travel time to Split in Croatia is from May til October and the best months are May, June and September.
Sail the crystal-clear waters of Croatia and enjoy its stunning coastline
Croatia is an idyllic sailing destination, boasting 1,777 miles (2,860 km) of beautiful beaches and pristine waters. With over 1,000 Islands dotting the Adriatic Sea, there's a perfect spot for everyone.
 Cycle the Danube trail
The Danube cycle route is one of the most popular cycling routes in Europe, and rightly so, because it is a varied route that is interesting both in terms of culture and nature.