Valongo Weather & Climate: Best Time to Visit
Average temperatures, rainfall, sunshine and the best time to visit Valongo.
Climate overview of Valongo
Valongo, Norte Region, Portugal, sees big temperature differences between seasons, with August peaking at 27°C (81°F) and January dropping to 14°C (57°F).
The city receives considerable rainfall, with around 1327 mm (52 in) annually. December is the wettest month. It has a distinct dry season from July to August, with warm summers and mild winters. The most sunshine falls in July, with an average of 10.2 hours of daily sunshine.
Valongo Weather by Month
Pick a month to see the average temperature, rainfall and sunshine in Valongo - and find the best time to visit.
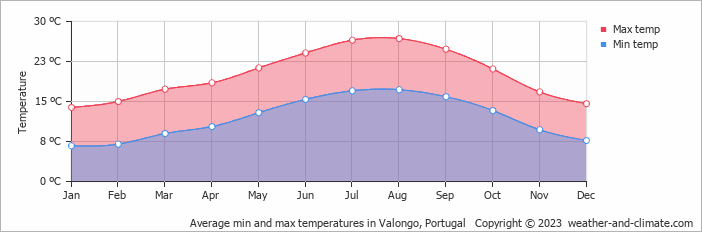
Monthly Temperature in Valongo
Visitors to Valongo can expect significant temperature changes throughout the year. Typically, average maximum daytime temperatures range from a comfortable 27°C (81°F) in August to a moderate 14°C (57°F) in the coolest month, January.
Nights vary from 17°C (63°F) in August to around 7°C (45°F) during the colder months.
Check out our detailed temperature page for more information.
Temperature ranges by month
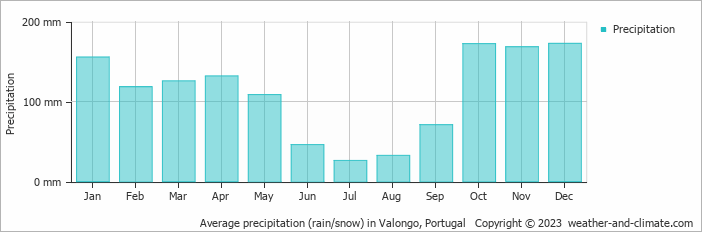
Rainfall in Valongo
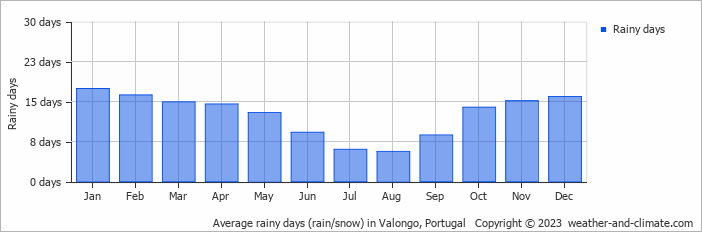
Valongo is known for its substantial rainfall, with annual precipitation reaching 1327 mm (52 in). The climate in Valongo shows significant variation throughout the year. Expect heavy rainfall in December, the wettest month, with an average of 173 mm (6.8 in) of precipitation over 16 rainy days.
In contrast, the driest month July offers drier and sunnier days, with around 26 mm (1 in) of rainfall over 6 rainy days. For more details, please visit our Valongo Precipitation page.
The mean monthly precipitation over the year, including rain, hail, and snow
The average number of days each month with precipitation
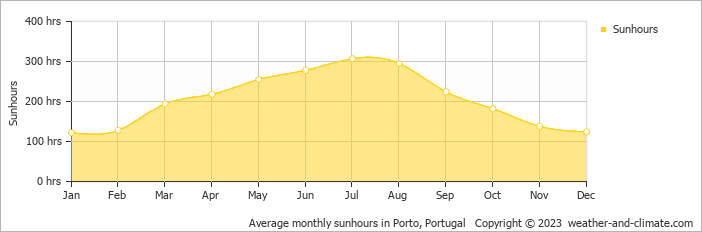
Sunshine Hours in Valongo
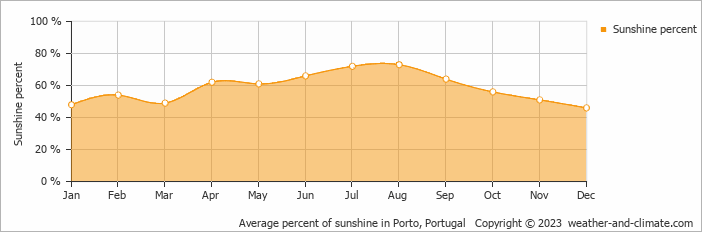
For those who appreciate different seasons, Valongo serves as an ideal destination. Expect longer, more sun-filled days in July with an average of 10.2 hours of sunshine daily, and embrace the darker days in January, offering only 4.1 hours of daily sunlight.
Visit our detailed sunshine hours page for more information.
Monthly hours of sunshine
Daily hours of sunshine
Daily percentage of sunshine
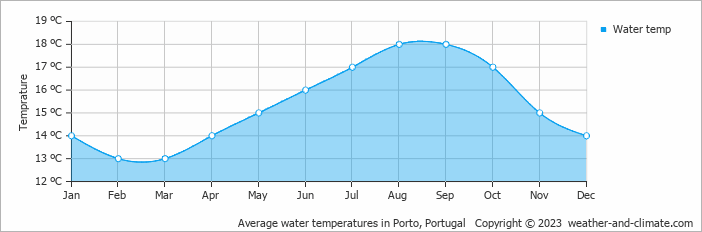
Water Temperature in Valongo
The mean water temperature over the year ranges from 13°C (55°F) in February to 18°C (64°F) in August.
Water temperature over the year
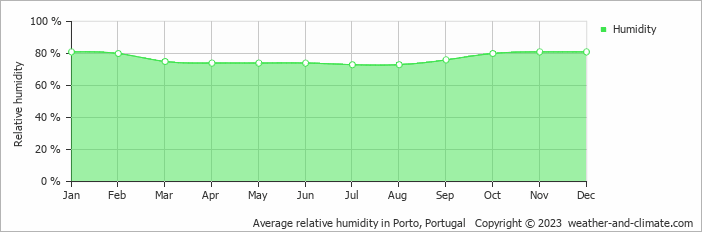
Humidity in Valongo by Month
The relative humidity is high throughout the year in Valongo.
The city experiences its highest humidity in January, reaching 81%. In July, the humidity drops to its lowest level at 73%. What does this mean? Read our detailed page on humidity levels for further details.
Relative humidity over the year
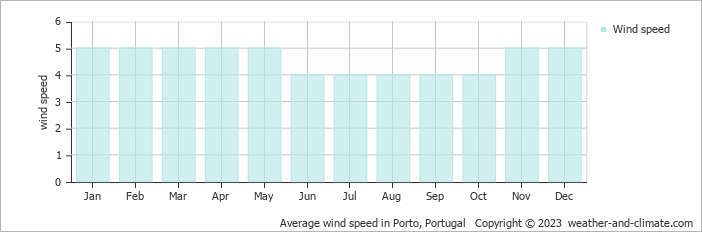
Wind Speed in Valongo
The average wind speed over the year ranges from 4 m/s (8 knots) to 5 m/s (10 knots). It is lower in June, July, August, September and October and higher in January, February, March, April, May, November and December. What does this mean?
The mean monthly wind speed over the year (meters per second)
Best Time to Visit Valongo
Monthly ratings reflect general weather comfort, based on daytime temperature and rainfall. Swimming and winter conditions are highlighted separately where relevant.
- Best overall: June, July, August and September
- Warmest weather: July and August
- Most sunshine: July and August
- Fewest rainy days: July and August
- Warmest water temperature: July, August, September and October, although the water may still feel cool.
- Seasonal pattern: A distinct dry season from July to August, with warm summers and mild winters
Frequently asked questions about the climate in Valongo
What is the best time to visit Valongo?
June, July, August and September typically offer the most optimal weather in Valongo. In contrast, January, February, March, November and December tend to have less optimal conditions. Valongo has a distinct dry season from July to August, with warm summers and mild winters.
What temperatures can I expect in Valongo?
Daytime highs range from 14°C (57°F) in January to 27°C (81°F) in August. Nighttime lows range from 7°C (45°F) to 17°C (63°F). Temperatures vary considerably through the year.
How much rain does Valongo get?
Annual rainfall is around 1327 mm (52 in). December is the wettest month with 173 mm (6.8 in), while July is the driest with 26 mm (1 in).
How sunny is Valongo?
Valongo receives around 2,465 hours of sunshine per year. July is the sunniest month with 307 hours, while January is the cloudiest with just 122 hours. Overall, Valongo enjoys abundant sunshine.
Valongo 3-Day Forecast
Valongo 3-Day Forecast
Valongo on the map
Valongo is highlighted - select any city to see its climate.
Popular this month
Where to go in July - average daytime high across popular destinations.
Bucket list
Need travel inspiration? Check out our bucket list articles and be inspired.
 7 of the most budget-friendly destinations in Europe
Discover Europe's top budget-friendly destinations including Budapest, Kotor, Krakow, and more, perfect for affordable and exciting travel.
 Alentejo, where time stands still
The quiet region is known for its rolling green hills and it is a true hiking paradise. Architectural highlights can be found in the castles, ancient monasteries or when exploring the countless charming villages.
An eco-friendly guide to Lagos travel
Lagos, Portugal is a great place to visit while being careful about your environmental footprint. Here you find some tips about environmentally places to stay, where to eat and how to get around in the area.
What to do in Lisbon: our tips for an unforgettable city trip
Lisbon is a bustling city with many special places. In this article you find the best sights, good restaurants and nice places to stay in Lisbon.